ブログ
/
/
July 9, 2019

Insights on Shamoon 3 Data-Wiping Malware

Gain insights into Shamoon 3 and learn how to protect your organization from its destructive capabilities.
Inside the SOC
Darktrace cyber analysts are world-class experts in threat intelligence, threat hunting and incident response, and provide 24/7 SOC support to thousands of Darktrace customers around the globe. Inside the SOC is exclusively authored by these experts, providing analysis of cyber incidents and threat trends, based on real-world experience in the field.
Written by
Max Heinemeyer
Global Field CISO
Default blog imageDefault blog imageDefault blog imageDefault blog imageDefault blog imageDefault blog image
09
Jul 2019

Responsible for some of the “most damaging cyber-attacks in history” since 2012, the Shamoon malware wipes compromised hard drives and overwrites key system processes, intending to render infected machines unusable. During a trial period in the network of a global company, Darktrace observed a Shamoon-powered cyber-attack on December 10, 2018 — when several Middle Eastern firms were impacted by a new variant of the malware.

While there has been detailed reporting on the malware files and wiper modules that these latest Shamoon attacks employed, the complete cyber kill chain involved remains poorly understood, while the intrusions that led to the malware’s eventual “detonation” last December has not received nearly as much coverage. As a consequence, this blog post will focus on the insights that Darktrace’s cyber AI generated regarding (a) the activity of the infected devices during the “detonation” and (b) the indicators of compromise that most likely represent lateral movement activity during the weeks prior.

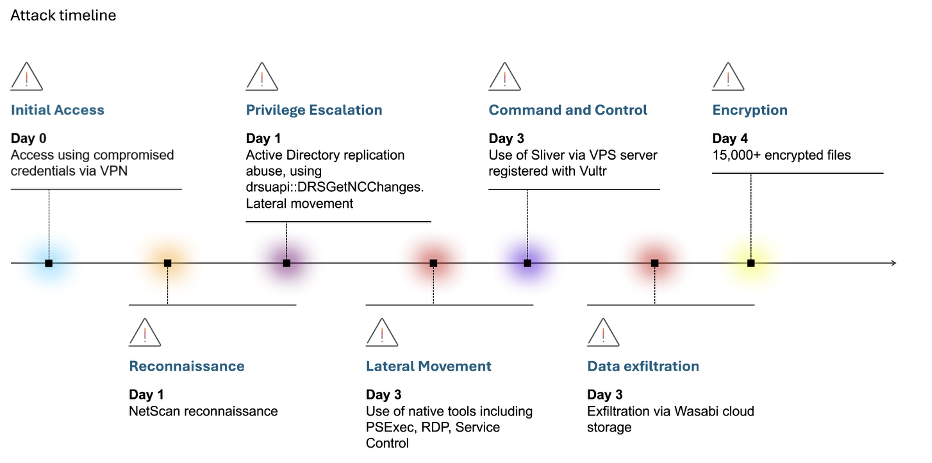
A high-level overview of major events leading up to the detonation on December 10th.

In the following, we will dive into that timeline more deeply in reverse chronological order, going back in time to trace the origins of the attack. Let’s begin with zero hour.

December 10: 42 devices “detonate”

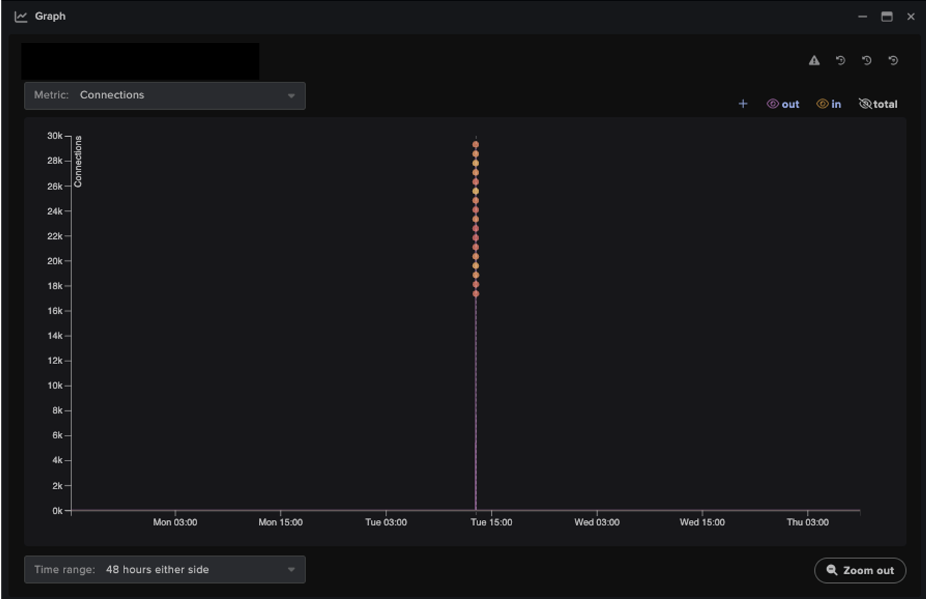
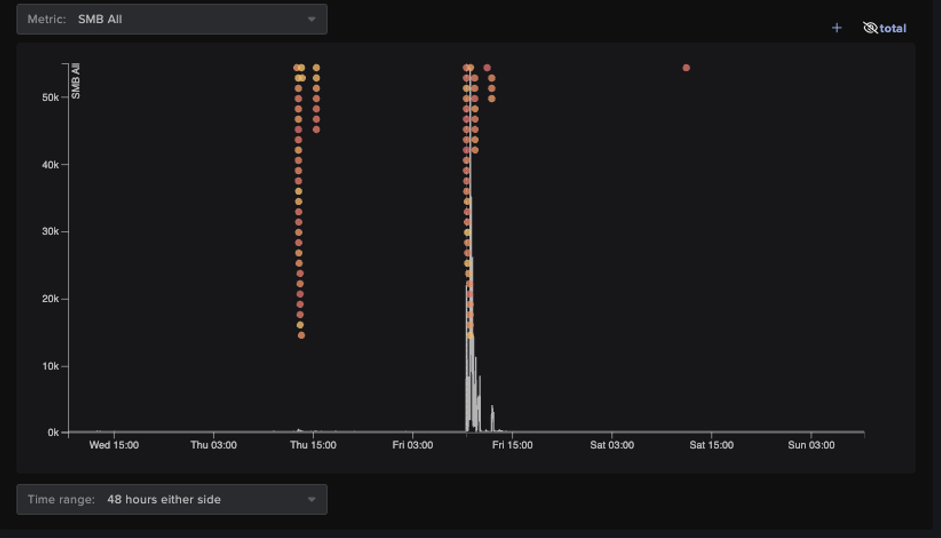
A bird's-eye perspective of how Darktrace identified the alerts in December 2018.

What immediately strikes the analyst’s eye is the fact that a large accumulation of alerts, indicated by the red rectangle above, took place on December 10, followed by complete network silence over the subsequent four days.

These highlighted alerts represent Darktrace’s detection of unusual network scans on remote port 445 that were conducted by 42 infected devices. These devices proceeded to scan more machines — none of which were among those already infected. Such behavior indicates that the compromised devices started scanning and were wiped independently from each other, instead of conducting worming-style activity during the detonation of the malware. The initial scanning device started its scan at 12:56 p.m. UTC, while the last scanning device started its scan at 2:07 p.m. UTC.

Not only was this activity readily apparent from the bird’s-eye perspective shown above, the detonating devices also created the highest-priority Darktrace alerts over a several day period: “Device / Network Scan” and “Device / Expanded Network Scan”:

Moreover, when investigating “Devices — Overall Score,” the detonating devices rank as the most critical assets for the time period December 8–11:

Darktrace AI generated all of the above alerts because they represented significant anomalies from the normal ‘pattern of life’ that the AI had learned for each user and device on the company’s network. Crucially, none of the alerts were the product of predefined ‘rules and signatures’ — the mechanism that conventional security tools rely on to detect cyber-threats. Rather, the AI revealed the activity because the scans were unusual for the devices given their precise nature and timing, demonstrating the necessity of the such a nuanced approach in catching elusive threats like Shamoon. Of further importance is that the company’s network consists of around 15,000 devices, meaning that a rules-based approach without the ability to prioritize the most serious threats would have drowned out the Shamoon alerts in noise.

Now that we’ve seen how cyber AI sounded the alarms during the detonation itself, let’s investigate the various indicators of suspicious lateral movement that precipitated the events of December 10. Most of this activity happened in brief bursts, each of which could have been spotted and remediated if Darktrace had been closely monitored.

November 19: Unusual Remote Powershell Usage (WinRM)

One such burst of unusual activity occurred on November 19, when Darktrace detected 14 devices — desktops and servers alike — that all successfully used the WinRM protocol. None of these devices had previously used WinRM, which is also unusual for the organization’s environment as a whole. Conversely, Remote PowerShell is quite often abused in intrusions during lateral movement. The devices involved did not classify as traditional administrative devices, making their use of WinRM even more suspicious.

Note the clustering of the WinRM activity as indicated by the timestamp on the left.

October 29–31: Scanning, Unusual PsExec & RDP Brute Forcing

Another burst of likely lateral movement occurred between October 29 and 31, when two servers were seen using PsExec in an unusual fashion. No PsExec activity had been observed in the network before or after these detections, prompting Darktrace to flag the behavior. One of the servers conducted an ICMP Ping sweep shortly before the lateral movement. Not only did both servers start using PsExec on the same day, they also used SMBv1 — which, again, was very unusual for the network.

Most legitimate administrative activity involving PsExec these days uses SMBv2. The graphic below shows several Darktrace alerts on one of the involved servers — take note of the chronology of detections at the bottom of the graphic. This clearly reads like an attacker’s diary: ICMP scan, SMBv1 usage, and unusual PsExec usage, followed by new remote service controls. This server was among the top five highest ranking devices during the analyzed time period and was easy to identify.

Following the PsExec use, the servers also started an anomalous amount of remote services via the srvsvc and svcctl pipes over SMB. They did so by starting services on remote devices with which they usually did not communicate — using SMBv1, of course. Some of the attempted communication failed due to access violation and access permission errors. Both are often seen during malicious lateral movement.

Additional context around the SMBv1 and remote srvsvc pipe activity. Note the access failure.

Thanks to Darktrace’s deep packet inspection, we can see exactly what happened on the application layer. Darktrace highlights any unusual or new activity in italics below the connections — we can easily see that the SMB activity is not only unusual because of SMBv1 being used, but also because this server had never used this type of SMB activity remotely to those particular destinations before. We can also observe remote access to the winreg pipe — likely indicating more lateral movement and persistence mechanisms being established.

The other server conducted some targeted address scanning on the network on October 29, employing typical lateral movement ports 135, 139 and 445:

Another device was observed to conduct RDP brute forcing on October 29 around the same time as the above address scan. The desktop made an unusual amount of RDP connections to another internal server.

A clear plateau in increased internal connections (blue) can be seen. Every colored dot on top represents an RDP brute force detection. This was again a clear-cut detection not drowned in other noise — these were the only RDP brute force detections for a several-month monitoring time window.

October 9–11: Unusual Credential Usage

Darktrace identifies the unusual use of credentials — for instance, if administrative credentials are used on client device on which they are not commonly used. This might indicate lateral movement where service accounts or local admin accounts have been compromised.

Darktrace identified another cluster of activity that is likely representing lateral movement, this time involving unusual credential usage. Between October 9 and 11, Darktrace identified 17 cases of new administrative credentials being used on client devices. While new administrative credentials were being used from time to time on devices as part of normal administrative activity, this strong clustering of unusual admin credential usage was outstanding. Additionally, Darktrace also identified the source of some of the credentials being used as unusual.

Conclusion

Having observed a live Shamoon infection within Darktrace, there are a few key takeaways. While the actual detonation on December 10 was automated, the intrusion that built up to it was most likely manual. The fact that all detonating devices started their malicious activity roughly at the same time — without scanning each other — indicates that the payload went off based on a trigger like a scheduled task. This is in line with other reporting on Shamoon 3.

In the weeks leading up to December 10, there were various significant signs of lateral movement that occurred in disparate bursts — indicating a ‘low-and-slow’ manual intrusion.

The adversaries used classic lateral movement techniques like RDP brute forcing, PsExec, WinRM usage, and the abuse of stolen administrative credentials.

While the organization in question had a robust security posture, an attacker only needs to exploit one vulnerability to bring down an entire system. During the lifecycle of the attack, the Darktrace Enterprise Immune System identified the threatening activity in real time and provided numerous suggested actions that could have prevented the Shamoon attack at various stages. However, human action was not taken, while the organization had yet to activate Antigena, Darktrace’s autonomous response solution, which could have acted in the security team’s stead.

Despite having limited scope during the trial period, the Enterprise Immune System was able to detect the lateral movement and detonation of the payload, which was indicative of the malicious Shamoon virus activity. A junior analyst could have easily identified the activity, as high-severity alerts were consistently generated, and the likely infected devices were at the top of the suspicious devices list.

Darktrace Antigena would have prevented the movement responsible for the spread of the virus, while also sending high-severity alerts to the security team to investigate the activity. Even the scanning on port 445 from the detonating devices would have been shut down, as it presented a significant deviation from the known behavior of all scanning devices, which would have further limited the virus’s spread, and ultimately, spared the company and its devices from attack.

Inside the SOC
Darktrace cyber analysts are world-class experts in threat intelligence, threat hunting and incident response, and provide 24/7 SOC support to thousands of Darktrace customers around the globe. Inside the SOC is exclusively authored by these experts, providing analysis of cyber incidents and threat trends, based on real-world experience in the field.
Written by
Max Heinemeyer
Global Field CISO

More in this series

No items found.

Blog

/

Cloud

/

March 5, 2026

Inside Cloud Compromise: Investigating Attacker Activity with Darktrace / Forensic Acquisition & Investigation

Default blog imageDefault blog image

Investigating Cloud Attacks with Forensic Acquisition & Investigation

Darktrace / Forensic Acquisition & Investigation™ is the industry’s first truly automated forensic solution purpose-built for the cloud. This blog will demonstrate how an investigation can be carried out against a compromised cloud server in minutes, rather than hours or days.

The compromised server investigated in this case originates from Darktrace’s Cloudypots system, a global honeypot network designed to observe adversary activity in real time across a wide range of cloud services. Whenever an attacker successfully compromises one of these honeypots, a forensic copy of the virtual server's disk is preserved for later analysis. Using Forensic Acquisition & Investigation, analysts can then investigate further and obtain detailed insights into the compromise including complete attacker timelines and root cause analysis.

Forensic Acquisition & Investigation supports importing artifacts from a variety of sources, including EC2 instances, ECS, S3 buckets, and more. The Cloudypots system produces a raw disk image whenever an attack is detected and stores it in an S3 bucket. This allows the image to be directly imported into Forensic Acquisition & Investigation using the S3 bucket import option.

As Forensic Acquisition & Investigation runs cloud-natively, no additional configuration is required to add a specific S3 bucket. Analysts can browse and acquire forensic assets from any bucket that the configured IAM role is permitted to access. Operators can also add additional IAM credentials, including those from other cloud providers, to extend access across multiple cloud accounts and environments.

Figure 1: Forensic Acquisition & Investigation import screen.

Forensic Acquisition & Investigation then retrieves a copy of the file and automatically begins running the analysis pipeline on the artifact. This pipeline performs a full forensic analysis of the disk and builds a timeline of the activity that took place on the compromised asset. By leveraging Forensic Acquisition & Investigation’s cloud-native analysis system, this process condenses hour of manual work into just minutes.

Successful import of a forensic artifact and initiation of the analysis pipeline.
Figure 2: Successful import of a forensic artifact and initiation of the analysis pipeline.

Once processing is complete, the preserved artifact is visible in the Evidence tab, along with a summary of key information obtained during analysis, such as the compromised asset’s hostname, operating system, cloud provider, and key event count.

The Evidence overview showing the acquired disk image.
Figure 3: The Evidence overview showing the acquired disk image.

Clicking on the “Key events” field in the listing opens the timeline view, automatically filtered to show system- generated alarms.

The timeline provides a chronological record of every event that occurred on the system, derived from multiple sources, including:

  • Parsed log files such as the systemd journal, audit logs, application specific logs, and others.
  • Parsed history files such as .bash_history, allowing executed commands to be shown on the timeline.
  • File-specific events, such as files being created, accessed, modified, or executables being run, etc.

This approach allows timestamped information and events from multiple sources to be aggregated and parsed into a single, concise view, greatly simplifying the data review process.

Alarms are created for specific timeline events that match either a built-in system rule, curated by Darktrace’s Threat Research team or an operator-defined created at the project level. These alarms help quickly filter out noise and highlight on events of interest, such as the creation of a file containing known malware, access to sensitive files like Amazon Web Service (AWS) credentials, suspicious arguments or commands, and more.

 The timeline view filtered to alarm_severity: “1” OR alarm_severity: “3”, showing only events that matched an alarm rule.
Figure 4: The timeline view filtered to alarm_severity: “1” OR alarm_severity: “3”, showing only events that matched an alarm rule.

In this case, several alarms were generated for suspicious Base64 arguments being passed to Selenium. Examining the event data, it appears the attacker spawned a Selenium Grid session with the following payload:

"request.payload": "[Capabilities {browserName: chrome, goog:chromeOptions: {args: [-cimport base64;exec(base64...], binary: /usr/bin/python3, extensions: []}, pageLoadStrategy: normal}]"

This is a common attack vector for Selenium Grid. The chromeOptions object is intended to specify arguments for how Google Chrome should be launched; however, in this case the attacker has abused the binary field to execute the Python3 binary instead of Chrome. Combined with the option to specify command-line arguments, the attacker can use Python3’s -c option to execute arbitrary Python code, in this instance, decoding and executing a Base64 payload.

Selenium’s logs truncate the Arguments field automatically, so an alternate method is required to retrieve the full payload. To do this, the search bar can be used to find all events that occurred around the same time as this flagged event.

Pivoting off the previous event by filtering the timeline to events within the same window using timestamp: [“2026-02-18T09:09:00Z” TO “2026-02-18T09:12:00Z”].
Figure 5: Pivoting off the previous event by filtering the timeline to events within the same window using timestamp: [“2026-02-18T09:09:00Z” TO “2026-02-18T09:12:00Z”].

Scrolling through the search results, an entry from Java’s systemd journal can be identified. This log contains the full, unaltered payload. GCHQ’s CyberChef can then be used to decode the Base64 data into the attacker’s script, which will ultimately be executed.[NJ9]

Continue reading
About the author
Nathaniel Bill
Malware Research Engineer

Blog

/

Network

/

February 19, 2026

CVE-2026-1731: How Darktrace Sees the BeyondTrust Exploitation Wave Unfolding

Default blog imageDefault blog image

Note: Darktrace's Threat Research team is publishing now to help defenders. We will continue updating this blog as our investigations unfold.

Background

On February 6, 2026, the Identity & Access Management solution BeyondTrust announced patches for a vulnerability, CVE-2026-1731, which enables unauthenticated remote code execution using specially crafted requests.  This vulnerability affects BeyondTrust Remote Support (RS) and particular older versions of Privileged Remote Access (PRA) [1].

A Proof of Concept (PoC) exploit for this vulnerability was released publicly on February 10, and open-source intelligence (OSINT) reported exploitation attempts within 24 hours [2].

Previous intrusions against Beyond Trust technology have been cited as being affiliated with nation-state attacks, including a 2024 breach targeting the U.S. Treasury Department. This incident led to subsequent emergency directives from  the Cybersecurity and Infrastructure Security Agency (CISA) and later showed attackers had chained previously unknown vulnerabilities to achieve their goals [3].

Additionally, there appears to be infrastructure overlap with React2Shell mass exploitation previously observed by Darktrace, with command-and-control (C2) domain  avg.domaininfo[.]top seen in potential post-exploitation activity for BeyondTrust, as well as in a React2Shell exploitation case involving possible EtherRAT deployment.

Darktrace Detections

Darktrace’s Threat Research team has identified highly anomalous activity across several customers that may relate to exploitation of BeyondTrust since February 10, 2026. Observed activities include:

Outbound connections and DNS requests for endpoints associated with Out-of-Band Application Security Testing; these services are commonly abused by threat actors for exploit validation.  Associated Darktrace models include:

  • Compromise / Possible Tunnelling to Bin Services

Suspicious executable file downloads. Associated Darktrace models include:

  • Anomalous File / EXE from Rare External Location

Outbound beaconing to rare domains. Associated Darktrace models include:

  • Compromise / Agent Beacon (Medium Period)
  • Compromise / Agent Beacon (Long Period)
  • Compromise / Sustained TCP Beaconing Activity To Rare Endpoint
  • Compromise / Beacon to Young Endpoint
  • Anomalous Server Activity / Rare External from Server
  • Compromise / SSL Beaconing to Rare Destination

Unusual cryptocurrency mining activity. Associated Darktrace models include:

  • Compromise / Monero Mining
  • Compromise / High Priority Crypto Currency Mining

And model alerts for:

  • Compromise / Rare Domain Pointing to Internal IP

IT Defenders: As part of best practices, we highly recommend employing an automated containment solution in your environment. For Darktrace customers, please ensure that Autonomous Response is configured correctly. More guidance regarding this activity and suggested actions can be found in the Darktrace Customer Portal.  

Appendices

Potential indicators of post-exploitation behavior:

·      217.76.57[.]78 – IP address - Likely C2 server

·      hXXp://217.76.57[.]78:8009/index.js - URL -  Likely payload

·      b6a15e1f2f3e1f651a5ad4a18ce39d411d385ac7  - SHA1 - Likely payload

·      195.154.119[.]194 – IP address – Likely C2 server

·      hXXp://195.154.119[.]194/index.js - URL – Likely payload

·      avg.domaininfo[.]top – Hostname – Likely C2 server

·      104.234.174[.]5 – IP address - Possible C2 server

·      35da45aeca4701764eb49185b11ef23432f7162a – SHA1 – Possible payload

·      hXXp://134.122.13[.]34:8979/c - URL – Possible payload

·      134.122.13[.]34 – IP address – Possible C2 server

·      28df16894a6732919c650cc5a3de94e434a81d80 - SHA1 - Possible payload

References:

1.        https://nvd.nist.gov/vuln/detail/CVE-2026-1731

2.        https://www.securityweek.com/beyondtrust-vulnerability-targeted-by-hackers-within-24-hours-of-poc-release/

3.        https://www.rapid7.com/blog/post/etr-cve-2026-1731-critical-unauthenticated-remote-code-execution-rce-beyondtrust-remote-support-rs-privileged-remote-access-pra/

Continue reading
About the author
Emma Foulger
Global Threat Research Operations Lead
あなたのデータ × DarktraceのAI
唯一無二のDarktrace AIで、ネットワークセキュリティを次の次元へ