ブログ
/
Network
/
October 30, 2024

Post-Exploitation Activities on Fortinet Devices: A Network-Based Analysis

This blog explores recent findings from Darktrace's Threat Research team on active exploitation campaigns targeting Fortinet appliances. This analysis focuses on the September 2024 exploitation of FortiManager via CVE-2024-47575, alongside related malicious activity observed in June 2024.
Inside the SOC
Darktrace cyber analysts are world-class experts in threat intelligence, threat hunting and incident response, and provide 24/7 SOC support to thousands of Darktrace customers around the globe. Inside the SOC is exclusively authored by these experts, providing analysis of cyber incidents and threat trends, based on real-world experience in the field.
Written by
Adam Potter
Senior Cyber Analyst
Default blog imageDefault blog imageDefault blog imageDefault blog imageDefault blog imageDefault blog image
30
Oct 2024

Introduction: Uncovering active exploitation of Fortinet vulnerabilities

As part of the Darktrace Threat Research team's routine analysis of October's Patch Tuesday vulnerabilities, the team began searching for signs of active exploitation of a critical vulnerability (CVE-2024-23113) affecting the FortiGate to FortiManager (FGFM) protocol.[1]

Although the investigation was prompted by an update regarding CVE 2024-23113, results of the inquiry yielded evidence of widespread exploitation of Fortinet devices in both June and September 2024 potentially via multiple vulnerabilities including CVE 2024-47575. Analysts identified two clusters of activity involving overlapping indicators of compromise (IoCs), likely constituting unique campaigns targeting Fortinet appliances.

This blog will first highlight the finding and analysis of the network-based indicators of FortiManager post-exploitation activity in September, likely involving CVE 2024-47575. The article will then briefly detail a similar pattern of malicious activity observed in June 2024 that involved similar IoCs that potentially comprises a distinct campaign targeting Fortinet perimeter devices.

Fortinet CVE Disclosures

FortiManager devices allow network administrators to manage Fortinet devices on organizations’ networks.[2] One such subset of devices managed through this method are Fortinet firewalls known as FortiGate. These manager and firewall devices communicate with each other via a custom protocol known as FortiGate to FortiManager (FGFM), whereby devices can perform reachability tests and configuration-related actions and reporting.[3] By default, FortiManager devices operate this protocol via port 541.[4]

Fortinet Product Security Incident Response Team released multiple announcements revealing vulnerabilities within the daemon responsible for implementing operability of the FGFM service. Specifically, CVE 2024-23113 enables attackers to potentially perform arbitrary remote command execution through the use of a specially crafted format string to a FortiGate device running the “fgfm daemon”.[5][6]  Similarly, the exploitation of CVE 2024-47575  could also allow remote command execution due to a missing authentication mechanism when targeting specifically FortiManager devices.[7][8]  Given how prolific both FortiGate and FortiManager devices are within the global IT security ecosystem, Darktrace analysts hypothesized that there may have been specific targeting of such devices within the customer base using these vulnerabilities throughout mid to late 2024.

Campaign Analysis

In light of these vulnerability disclosures, Darktrace’s Threat Research team began searching for signs of active exploitation by investigating file download, lateral movement or tooling activity from devices that had previously received suspicious connections on port 541. The team first noticed increases in suspicious activity involving Fortinet devices particularly in mid-September 2024. Further analysis revealed a similar series of activities involving some overlapping devices identified in June 2024. Analysis of these activity clusters revealed a pattern of malicious activity against likely FortiManager devices, including initial exploitation, payload retrieval, and exfiltration of probable configuration data.

Below is an overview of malicious activity we have observed by sector and region:

Sector and region affected by malicious activity on fortigate devices
The sectors of affected customers listed above are categorized according to the United Kingdom’s Standard Industrial Classification (SIC).

Initial Exploitation of FortiManager Devices

Across many of the observed cases in September, activity began with the initial exploitation of FortiManager devices via incoming connectivity over TLS/SSL. Such activity was detected due to the rarity of the receiving devices accepting connections from external sources, particularly over destination port 541. Within nearly all investigated incidents, connectivity began with the source IP, 45.32.41[.]202, establishing an SSL session with likely FortiManager devices.  Device types were determined through a combination of the devices’ hostnames and the noted TLS certificate issuer for such encrypted connections.

Due to the encrypted nature of the connection, it was not possible to ascertain the exploit used in the analyzed cases. However, given the similarity of activities targeting FortiManager devices and research conducted by outside firms, attackers likely utilized CVE 2024-47575.[9] For example, the source IP initiating the SSL sessions also has been referenced by Mandiant as engaging in CVE 2024-47575 exploitation. In addition to a consistent source IP for the connections, a similar JA3 hash was noted across multiple examined accounts, suggesting a similarity in source process for the activity.

In most cases observed by Darktrace, the incoming connectivity was followed by an outgoing connection on port 443 to the IP 45.32.41[.]202. Uncommon reception of encrypted connections over port 541, followed by the initiation of outgoing SSL connections to the same endpoint would suggest probable successful exploitation of FortiManager CVEs during this time.

Model alert logs highlighting the incoming connectivity over port 541 to the FortiManager devices followed by outgoing connection to the external IP.
Figure 1: Model alert logs highlighting the incoming connectivity over port 541 to the FortiManager devices followed by outgoing connection to the external IP.

Payload Retrieval

Investigated devices commonly retrieved some form of additional content after incoming connectivity over port 541. Darktrace’s Threat Research team noted how affected devices would make HTTP GET requests to the initial exploitation IP for the URI: /dom.js. This URI, suggestive of JavaScript content retrieval, was then validated by the HTTP response content type. Although Darktrace could see the HTTP content of the connections, usage of destination port 443 featured prominently during these HTTP requests, suggesting an attempt at encryption of the session payload details.

Figure 2: Advanced Search HTTP log to the exploitation IP noting the retrieval of JavaScript content using the curl user agent.

Cyber AI Analyst investigation into the initial exploitation activity. This incident emphasizes the rare external connectivity over port 443 requesting JavaScript content following the incoming connections over port 541.
Figure 3: Cyber AI Analyst investigation into the initial exploitation activity. This incident emphasizes the rare external connectivity over port 443 requesting JavaScript content following the incoming connections over port 541.

The operators of the campaign also appear to have used a consistent user agent for payload retrieval: curl 8.4.0. Usage of an earlier version of the curl (version 7 .86.0) was only observed in one instance. The incorporation of curl utility to establish HTTP connections therefore suggests interaction with command-line utilities on the inspected Fortinet hosts. Command-line interaction also adds validity to the usage of exploits such as CVE 2024-47575 which enable unauthenticated remote command execution. Moreover, given the egress of data seen by the devices receiving this JavaScript content, Darktrace analysts concluded that this payload likely resulted in the configuration aggregation activity noted by external researchers.

Data Exfiltration

Nearly all devices investigated during the September time period performed some form of data exfiltration using the HTTP protocol. Most frequently, devices would initiate these HTTP requests using the same curl user agent already observed during web callback activity.  Again, usage of this tool heavily suggests interaction with the command-line interface and therefore command execution.

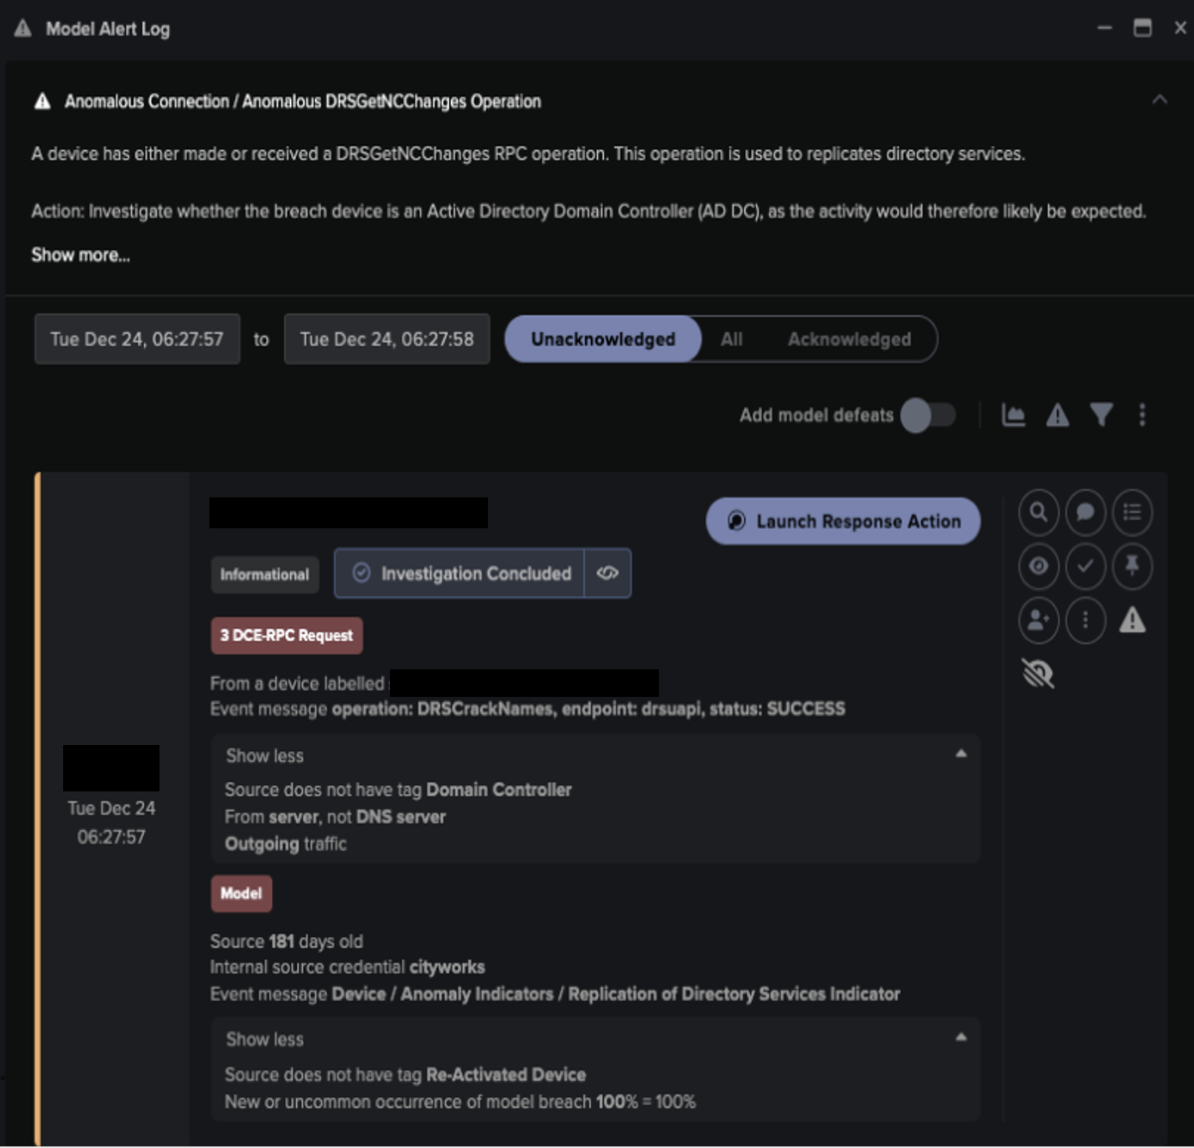
The affected device typically made an HTTP POST request to one or both of the following two rare external IPs: 104.238.141[.]143 and 158.247.199[.]37. One of the noted IPs, 104.238.141[.]143, features prominently within external research conducted by Mandiant during this time. These HTTP POST requests nearly always sent data to the /file endpoint on the destination IPs. Analyzed connections frequently noted an HTTP mime type suggestive of compressed archive content. Some investigations also revealed specific filenames for the data sent externally: “.tm”. HTTP POST requests occurred without a specified hostname. This would suggest the IP address may have already been cached locally on the device from a running process or the IP address was hardcoded into the details of unwarranted code running on the system. Moreover, many such POSTs occurred without a GET request, which can indicate exfiltration activity.
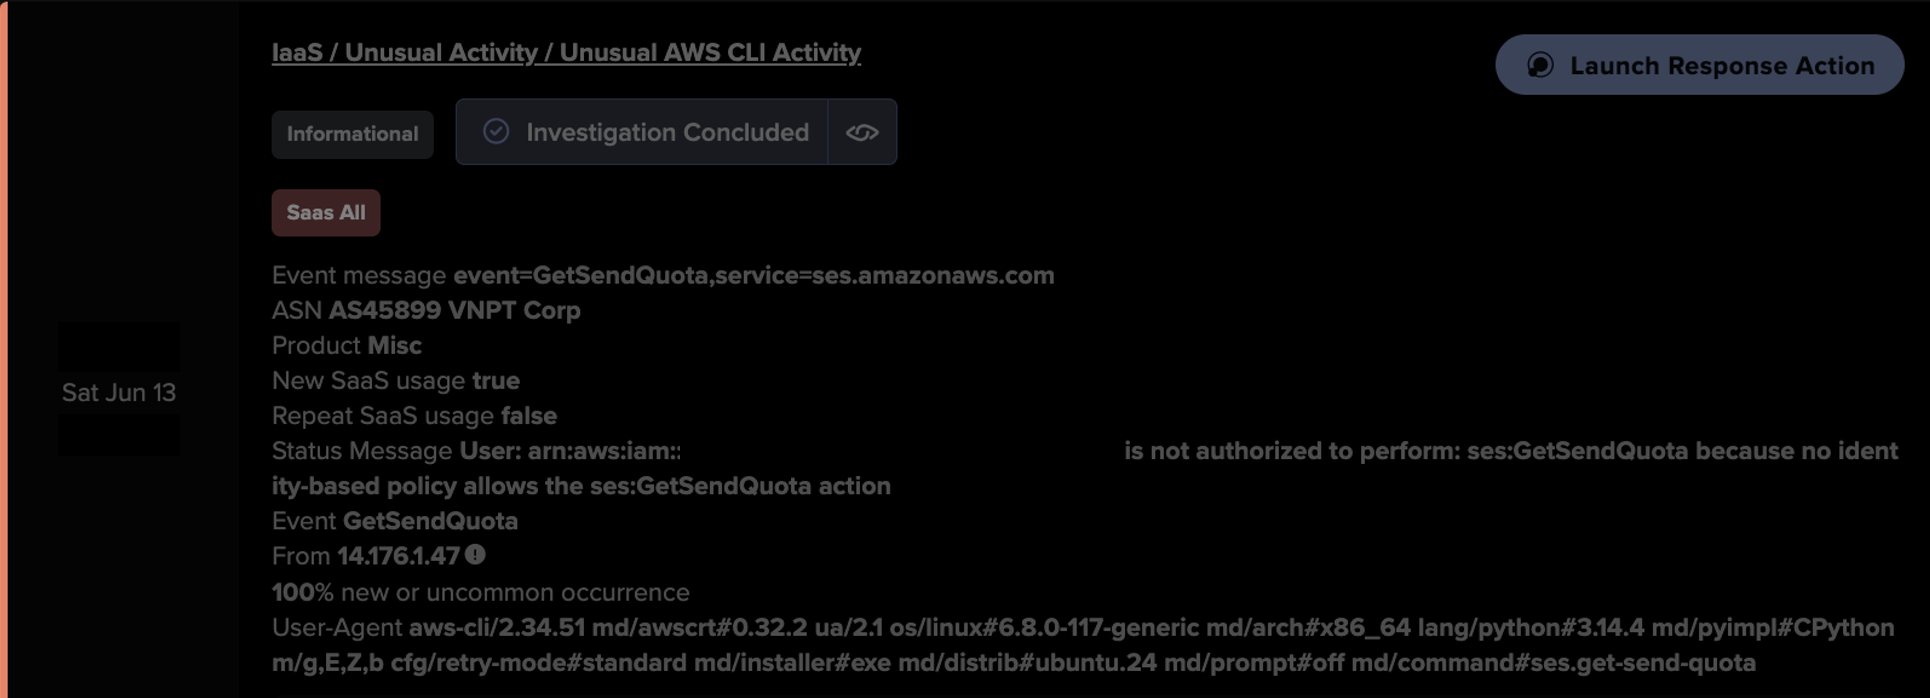
Model alert logs noting both the connection to the IP 158.247.199[.]37 over port 443 without a hostname, and the unusual activity metric describing how the request was made without a prior HTTP GET request. Such activity can indicate malicious data exfiltration.
Figure 4: Model alert logs noting both the connection to the IP 158.247.199[.]37 over port 443 without a hostname, and the unusual activity metric describing how the request was made without a prior HTTP GET request. Such activity can indicate malicious data exfiltration.

Interestingly, in many investigations, analysts noticed a lag period between the initial access and exploitation, and the exfiltration of data via HTTP. Such a pause, sometimes over several hours to over a day, could reflect the time needed to aggregate data locally on the host or as a strategic pause in activity to avoid detection. While not present within every compromise activity logs inspected, the delay could represent slight adjustments in behavior during the campaign by the threat actor.

Figure 5: Advanced search logs showing both the payload retrieval and exfiltration activity, emphasizing the gap in time between payload retrieval and exfiltration via HTTP POST request.

HTTP and file identification details identified during this time also directly correspond to research conducted by Mandiant. Not only do we see overlap in IPs identified as receiving the posted data (104.238.141[.]143) we also directly observed an overlap in filenames for the locally aggregated configuration data. Moreover, the gzip mime type identified in multiple customer investigations also corresponds directly to exfiltration activity noted by Mandiant researchers.

Advanced search logs noting the filename and URL of the posted data to one of the exfiltration IPs. The .tm filename corresponds to the locally stored file on affected FortiManager devices analyzed by external researchers.
Figure 6: Advanced search logs noting the filename and URL of the posted data to one of the exfiltration IPs. The .tm filename corresponds to the locally stored file on affected FortiManager devices analyzed by external researchers.

Activity detected in June 2024

Common indicators

Analysts identified a similar pattern of activity between June 23 and June 25. Activity in this period involved incoming connections from the aforementioned IP 45.32.41[.]202 on either port 541 or port 443 followed by an outgoing connection to the source. This behavior was then followed by HTTP POSTs to the previously mentioned IP address 158.247.199[.]37 in addition to the novel IP: 195.85.114[.]78  using same URI ‘/file’ noted above. Given the commonalties in indicators, time period, and observed behaviors, this grouping of exploitation attempts appears to align closely with the campaign described by Mandiant and may represent exploitation of CVE 2024-47575 in June 2024. The customers targeted in June fall into the same regions and sectors as seen those in the September campaign.

Deviations in behavior

Notably, Darktrace detected a different set of actions during the same June timeframe despite featuring the same infrastructure. This activity involved an initial incoming connection from 158.247.199[.]37 to an internal device on either port 541 or port 443. This was then followed by an outgoing HTTP connection to 158.247.199[.]37 on port 443 with a URI containing varying external IPs. Upon further review, analysts noticed the IPs listed may be the public IPs of the targeted victim, suggesting a potential form device registration by the threat actor or exploit validation. While the time period and infrastructure closely align with the previous campaign described, the difference in activity may suggest another threat actor sharing infrastructure or the same threat actor carrying out a different campaign at the same time. Although the IP 45.32.41[.]202 was contacted, paralleling activity seen in September, analysts did notice a different payload received from the external host, a shell script with the filename ver.sh.

Figure 7: AI Analyst timeline noting the suspicious HTTP behavior from a FortiManager device involving the IP 158.247.199[.] 37.

Darktrace's depth of detection and investigation

Darktrace detected spikes in anomalous behavior from Fortinet devices within the customer base between September 22 and 23, 2024. Following an in-depth investigation into affected accounts and hosts, Darktrace identified a clear pattern where one, or multiple, threat actors leveraged CVEs affecting likely FortiManager devices to execute commands on the host, retrieve malicious content, and exfiltrate sensitive data. During this investigation, analysts then identified possibly related activity in June 2024 highlighted above.

The gathering and exfiltration of configuration data from network security management or other perimeter hosts is a technique that can enable future access by threat actors. This parallels activity previously discussed by Darktrace focused on externally facing devices, such as Palo Alto Networks firewall devices.  Malicious entities could utilize stolen configuration data and potentially stored passwords/hashes to gain initial access in the future, irrespective of the state of device patching. This data can also be potentially sold by initial access brokers on illicit sites. Moreover, groups can leverage this information to establish persistence mechanisms within devices and host networks to enable more impactful compromise activity.

Uncover threat pattens before they strike your network

Network and endpoint management services are essential tools for network administrators and will remain a critical part of IT infrastructure. However, these devices are often configured as internet-facing systems, which can unintentionally expose organizations networks' to attacks. Internet exposure provides malicious groups with novel entry routes into target environments. Although threat actors can swap vulnerabilities to access target networks, the exploitation process leaves behind unusual traffic patterns, making their presence detectable with the right network detection tools.

By detecting the unusual patterns of network traffic which inevitably ensue from exploitation of novel vulnerabilities, Darktrace’s anomaly-based detection and response approach can continue to identify and inhibit such intrusion activities irrespective of exploit used. Eulogizing the principle of least privilege, configuration and asset management, and maintaining the CIA Triad across security operations will continue to help security teams boost their defense posture.

See how anomaly-based detection can enhance your security operations—schedule a personalized demo today.

Get a demo button for Darktrace

Credit to Adam Potter (Senior Cyber Analyst), Emma Foulger (Principal Cyber Analyst), Nahisha Nobregas (Senior Cyber Analyst), Hyeongyung Yeom (Principal Cyber Analyst & Analyst Team Lead, East Asia), Sam Lister (Senior Cyber Analyst)

Appendix

Model Alerts

  • Anomalous Connection / Posting HTTP to IP without Hostname
  • Anomalous Connection / Callback on Web Facing Device
  • Anomalous Server Activity / New Internet Facing Server
  • Anomalous Server Activity / Outgoing from Server

Cyber AI Analyst Incidents

  • Possible HTTP Command and Control
  • Possible HTTP Command and Control to Multiple Endpoints

IoCs

Indicator – Type - Description

104.238.141[.]143 -  IP Address  - C2 infrastructure

158.247.199[.]37 - IP Address - C2 infrastructure

45.32.41[.]202 - IP Address - C2 infrastructure

104.238.141[.]143/file – URL - C2 infrastructure

158.247.199[.]37/file  - URL - C2 infrastructure

45.32.41[.]202/dom.js – URL - C2 infrastructure

.tm – Filename - Gzip file

MITRE Attack Framework

  • Initial Access
    T1190 Exploiting Public-Facing Application
  • Execution:
    T1059 Command and Scripting Interpreter  (Sub-Techniques: T1059.004 Unix Shell, T1059.008 Network Device CLI)
  • Discovery:
    T1083 File and System Discovery
    T1057 Process Discovery
  • Collection:
    T1005 Data From Local System
  • Command and Control:
    T1071 Application Layer Protocols (Sub-Technique:
    T1071.001 Web Protocols)
    T1573  Encrypted Channel
    T1573.001  Symmetric Cryptography
    T1571 Non-Standard Port
    T1105 Ingress Tool Transfer
    T1572 Protocol Tunnelling 
  • Exfiltration:
    T1048.003 Exfiltration Over Unencrypted Non-C2 Protocol

References

{1} https://cloud.google.com/blog/topics/threat-intelligence/fortimanager-zero-day-exploitation-cve-2024-47575/

{2} https://docs.fortinet.com/document/fortimanager/6.4.0/ports-and-protocols/606094/fortigate-fortimanager-protocol#:~:text=The%20FortiGate%2DFortiManager%20(FGFM),by%20using%20the%20FGFM%20protocol.

{3)https://docs.fortinet.com/document/fortigate/6.4.0/ports-and-protocols/373486/fgfm-fortigate-to-fortimanager-protocol
{4} https://www.fortiguard.com/psirt/FG-IR-24-029
{5} https://www.fortiguard.com/psirt/FG-IR-24-423
{6}https://www.fortinet.com/content/dam/fortinet/assets/data-sheets/fortimanager.pdf

{7} https://doublepulsar.com/burning-zero-days-fortijump-fortimanager-vulnerability-used-by-nation-state-in-espionage-via-msps-c79abec59773

{8} https://darktrace.com/blog/post-exploitation-activities-on-pan-os-devices-a-network-based-analysis

Inside the SOC
Darktrace cyber analysts are world-class experts in threat intelligence, threat hunting and incident response, and provide 24/7 SOC support to thousands of Darktrace customers around the globe. Inside the SOC is exclusively authored by these experts, providing analysis of cyber incidents and threat trends, based on real-world experience in the field.
Written by
Adam Potter
Senior Cyber Analyst

More in this series

No items found.

Blog

/

Network

/

February 3, 2026

Darktrace Malware Analysis: Unpacking SnappyBee

Default blog imageDefault blog image

Introduction

The aim of this blog is to be an educational resource, documenting how an analyst can perform malware analysis techniques such as unpacking. This blog will demonstrate the malware analysis process against well-known malware, in this case SnappyBee.

SnappyBee (also known as Deed RAT) is a modular backdoor that has been previously attributed to China-linked cyber espionage group Salt Typhoon, also known as Earth Estries [1] [2]. The malware was first publicly documented by TrendMicro in November 2024 as part of their investigation into long running campaigns targeting various industries and governments by China-linked threat groups.

In these campaigns, SnappyBee is deployed post-compromise, after the attacker has already obtained access to a customer's system, and is used to establish long-term persistence as well as deploying further malware such as Cobalt Strike and the Demodex rootkit.

To decrease the chance of detection, SnappyBee uses a custom packing routine. Packing is a common technique used by malware to obscure its true payload by hiding it and then stealthily loading and executing it at runtime. This hinders analysis and helps the malware evade detection, especially during static analysis by both human analysts and anti-malware services.

This blog is a practical guide on how an analyst can unpack and analyze SnappyBee, while also learning the necessary skills to triage other malware samples from advanced threat groups.

First principles

Packing is not a new technique, and threat actors have generally converged on a standard approach. Packed binaries typically feature two main components: the packed data and an unpacking stub, also called a loader, to unpack and run the data.

Typically, malware developers insert a large blob of unreadable data inside an executable, such as in the .rodata section. This data blob is the true payload of the malware, but it has been put through a process such as encryption, compression, or another form of manipulation to render it unreadable. Sometimes, this data blob is instead shipped in a different file, such as a .dat file, or a fake image. When this happens, the main loader has to read this using a syscall, which can be useful for analysis as syscalls can be easily identified, even in heavily obfuscated binaries.

In the main executable, malware developers will typically include an unpacking stub that takes the data blob, performs one or more operations on it, and then triggers its execution. In most samples, the decoded payload data is loaded into a newly allocated memory region, which will then be marked as executable and executed. In other cases, the decoded data is instead dropped into a new executable on disk and run, but this is less common as it increases the likelihood of detection.

Finding the unpacking routine

The first stage of analysis is uncovering the unpacking routine so it can be reverse engineered. There are several ways to approach this, but it is traditionally first triaged via static analysis on the initial stages available to the analyst.

SnappyBee consists of two components that can be analyzed:

  • A Dynamic-link Library (DLL) that acts as a loader, responsible for unpacking the malicious code
  • A data file shipped alongside the DLL, which contains the encrypted malicious code

Additionally, SnappyBee includes a legitimate signed executable that is vulnerable to DLL side-loading. This means that when the executable is run, it will inadvertently load SnappyBee’s DLL instead of the legitimate one it expects. This allows SnappyBee to appear more legitimate to antivirus solutions.

The first stage of analysis is performing static analysis of the DLL. This can be done by opening the DLL within a disassembler such as IDA Pro. Upon opening the DLL, IDA will display the DllMain function, which is the malware’s initial entry point and the first code executed when the DLL is loaded.

The DllMain function
Figure 1: The DllMain function

First, the function checks if the variable fdwReason is set to 1, and exits if it is not. This variable is set by Windows to indicate why the DLL was loaded. According to Microsoft Developer Network (MSDN), a value of 1 corresponds to DLL_PROCESS_ATTACH, meaning “The DLL is being loaded into the virtual address space of the current process as a result of the process starting up or as a result of a call to LoadLibrary” [3]. Since SnappyBee is known to use DLL sideloading for execution, DLL_PROCESS_ATTACH is the expected value when the legitimate executable loads the malicious DLL.

SnappyBee then uses the GetModule and GetProcAddress to dynamically resolve the address of the VirtualProtect in kernel32 and StartServiceCtrlDispatcherW in advapi32. Resolving these dynamically at runtime prevents them from showing up as a static import for the module, which can help evade detection by anti-malware solutions. Different regions of memory have different permissions to control what they can be used for, with the main ones being read, write, and execute. VirtualProtect is a function that changes the permissions of a given memory region.

SnappyBee then uses VirtualProtect to set the memory region containing the code for the StartServiceCtrlDispatcherW function as writable. It then inserts a jump instruction at the start of this function, redirecting the control flow to one of the SnappyBee DLL’s other functions, and then restores the old permissions.

In practice, this means when the legitimate executable calls StartServiceCtrlDispatcherW, it will immediately hand execution back to SnappyBee. Meanwhile, the call stack now appears more legitimate to outside observers such as antimalware solutions.

The hooked-in function then reads the data file that is shipped with SnappyBee and loads it into a new memory allocation. This pattern of loading the file into memory likely means it is responsible for unpacking the next stage.

The start of the unpacking routine that reads in dbindex.dat.
Figure 2: The start of the unpacking routine that reads in dbindex.dat.

SnappyBee then proceeds to decrypt the memory allocation and execute the code.

The memory decryption routine.
Figure 3: The memory decryption routine.

This section may look complex, however it is fairly straight forward. Firstly, it uses memset to zero out a stack variable, which will be used to store the decryption key. It then uses the first 16 bytes of the data file as a decryption key to initialize the context from.

SnappyBee then calls the mbed_tls_arc4_crypt function, which is a function from the mbedtls library. Documentation for this function can be found online and can be referenced to better understand what each of the arguments mean [4].

The documentation for mbedtls_arc4_crypt.
Figure 4: The documentation for mbedtls_arc4_ crypt.

Comparing the decompilation with the documentation, the arguments SnappyBee passes to the function can be decoded as:

  • The context derived from 16-byte key at the start of the data is passed in as the context in the first parameter
  • The file size minus 16 bytes (to account for the key at the start of the file) is the length of the data to be decrypted
  • A pointer to the file contents in memory, plus 16 bytes to skip the key, is used as the input
  • A pointer to a new memory allocation obtained from VirtualAlloc is used as the output

So, putting it all together, it can be concluded that SnappyBee uses the first 16 bytes as the key to decrypt the data that follows , writing the output into the allocated memory region.

SnappyBee then calls VirtualProtect to set the decrypted memory region as Read + Execute, and subsequently executes the code at the memory pointer. This is clearly where the unpacked code containing the next stage will be placed.

Unpacking the malware

Understanding how the unpacking routine works is the first step. The next step is obtaining the actual code, which cannot be achieved through static analysis alone.

There are two viable methods to retrieve the next stage. The first method is implementing the unpacking routine from scratch in a language like Python and running it against the data file.

This is straightforward in this case, as the unpacking routine in relatively simple and would not require much effort to re-implement. However, many unpacking routines are far more complex, which leads to the second method: allowing the malware to unpack itself by debugging it and then capturing the result. This is the approach many analysts take to unpacking, and the following will document this method to unpack SnappyBee.

As SnappyBee is 32-bit Windows malware, debugging can be performed using x86dbg in a Windows sandbox environment to debug SnappyBee. It is essential this sandbox is configured correctly, because any mistake during debugging could result in executing malicious code, which could have serious consequences.

Before debugging, it is necessary to disable the DYNAMIC_BASE flag on the DLL using a tool such as setdllcharacteristics. This will stop ASLR from randomizing the memory addresses each time the malware runs and ensures that it matches the addresses observed during static analysis.

The first place to set a breakpoint is DllMain, as this is the start of the malicious code and the logical place to pause before proceeding. Using IDA, the functions address can be determined; in this case, it is at offset 10002DB0. This can be used in the Goto (CTRL+G) dialog to jump to the offset and place a breakpoint. Note that the “Run to user code” button may need to be pressed if the DLL has not yet been loaded by x32dbg, as it spawns a small process to load the DLL as DLLs cannot be executed directly.

The program can then run until the breakpoint, at which point the program will pause and code recognizable from static analysis can be observed.

Figure 5: The x32dbg dissassembly listing forDllMain.

In the previous section, this function was noted as responsible for setting up a hook, and in the disassembly listing the hook address can be seen being loaded at offset 10002E1C. It is not necessary to go through the whole hooking process, because only the function that gets hooked in needs to be run. This function will not be naturally invoked as the DLL is being loaded directly rather than via sideloading as it expects. To work around this, the Extended Instruction Pointer (EIP) register can be manipulated to point to the start of the hook function instead, which will cause it to run instead of the DllMain function.

To update EIP, the CRTL+G dialog can again be used to jump to the hook function address (10002B50), and then the EIP register can be set to this address by right clicking the first instruction and selecting “Set EIP here”. This will make the hook function code run next.

Figure 6: The start of the hookedin-in function

Once in this function, there are a few addresses where breakpoints should be set in order to inspect the state of the program at critical points in the unpacking process. These are:

-              10002C93, which allocates the memory for the data file and final code

-              10002D2D, which decrypts the memory

-              10002D81, which runs the unpacked code

Setting these can be done by pressing the dot next to the instruction listing, or via the CTRL+G Goto menu.

At the first breakpoint, the call to VirtualAlloc will be executed. The function returns the memory address of the created memory region, which is stored in the EAX register. In this case, the region was allocated at address 00700000.

Figure 7: The result of the VirtualAlloc call.

It is possible to right click the address and press “Follow in dump” to pin the contents of the memory to the lower pane, which makes it easy to monitor the region as the unpacking process continues.

Figure 8: The allocated memory region shown in x32dbg’s dump.

Single-stepping through the application from this point eventually reaches the call to ReadFile, which loads the file into the memory region.

Figure 9: The allocated memory region after the file is read into it, showing high entropy data.

The program can then be allowed to run until the next breakpoint, which after single-stepping will execute the call to mbedtls_arc4_crypt to decrypt the memory. At this point, the data in the dump will have changed.

Figure 10: The same memory region after the decryption is run, showing lower entropy data.

Right-clicking in the dump and selecting "Disassembly” will disassemble the data. This yields valid shell code, indicating that the unpacking succeeded, whereas corrupt or random data would be expected if the unpacking had failed.

Figure 11: The disassembly view of the allocated memory.

Right-clicking and selecting “Follow in memory map” will show the memory allocation under the memory map view. Right-clicking this then provides an option to dump the entire memory block to file.

Figure 12: Saving the allocated memory region.

This dump can then be opened in IDA, enabling further static analysis of the shellcode. Reviewing the shellcode, it becomes clear that it performs another layer of unpacking.

As the debugger is already running, the sample can be allowed to execute up to the final breakpoint that was set on the call to the unpacked shellcode. Stepping into this call will then allow debugging of the new shellcode.

The simplest way to proceed is to single-step through the code, pausing on each call instruction to consider its purpose. Eventually, a call instruction that points to one of the memory regions that were assigned will be reached, which will contain the next layer of unpacked code. Using the same disassembly technique as before, it can be confirmed that this is more unpacked shellcode.

Figure 13: The unpacked shellcode’s call to RDI, which points to more unpacked shellcode. Note this screenshot depicts the 64-bit variant of SnappyBee instead of 32-bit, however the theory is the same.

Once again, this can be dumped out and analyzed further in IDA. In this case, it is the final payload used by the SnappyBee malware.

Conclusion

Unpacking remains one of the most common anti-analysis techniques and is a feature of most sophisticated malware from threat groups. This technique of in-memory decryption reduces the forensic “surface area” of the malware, helping it to evade detection from anti-malware solutions. This blog walks through one such example and provides practical knowledge on how to unpack malware for deeper analysis.

In addition, this blog has detailed several other techniques used by threat actors to evade analysis, such as DLL sideloading to execute code without arising suspicion, dynamic API resolving to bypass static heuristics, and multiple nested stages to make analysis challenging.

Malware such as SnappyBee demonstrates a continued shift towards highly modular and low-friction malware toolkits that can be reused across many intrusions and campaigns. It remains vital for security teams  to maintain the ability to combat the techniques seen in these toolkits when responding to infections.

While the technical details of these techniques are primarily important to analysts, the outcomes of this work directly affect how a Security Operations Centre (SOC) operates at scale. Without the technical capability to reliably unpack and observe these samples, organizations are forced to respond without the full picture.

The techniques demonstrated here help close that gap. This enables security teams to reduce dwell time by understanding the exact mechanisms of a sample earlier, improve detection quality with behavior-based indicators rather than relying on hash-based detections, and increase confidence in response decisions when determining impact.

Credit to Nathaniel Bill (Malware Research Engineer)
Edited by Ryan Traill (Analyst Content Lead)

Indicators of Compromise (IoCs)

SnappyBee Loader 1 - 25b9fdef3061c7dfea744830774ca0e289dba7c14be85f0d4695d382763b409b

SnappyBee Loader 2 - b2b617e62353a672626c13cc7ad81b27f23f91282aad7a3a0db471d84852a9ac          

SnappyBee Payload - 1a38303fb392ccc5a88d236b4f97ed404a89c1617f34b96ed826e7bb7257e296

References

[1] https://www.trendmicro.com/en_gb/research/24/k/earth-estries.html

[2] https://www.darktrace.com/blog/salty-much-darktraces-view-on-a-recent-salt-typhoon-intrusion

[3] https://learn.microsoft.com/en-us/windows/win32/dlls/dllmain#parameters

[4] https://mbed-tls.readthedocs.io/projects/api/en/v2.28.4/api/file/arc4_8h/#_CPPv418mbedtls_arc4_cryptP20mbedtls_arc4_context6size_tPKhPh

Continue reading
About the author
Nathaniel Bill
Malware Research Engineer

Blog

/

AI

/

February 4, 2026

The State of AI Cybersecurity 2026: Unveiling insights from over 1,500 security leaders

Default blog imageDefault blog image

2025 was the year enterprise AI went mainstream. In 2026, it’s made its way into every facet of the organizational structure – transforming workflows, revolutionizing productivity, and creating new value streams. In short, it’s opened up a whole new attack surface.  

At the same time, AI has accelerated the pace of cybersecurity arms race on both sides: adversaries are innovating using the latest AI technologies at their disposal while defenders scramble to outmaneuver them and stay ahead of AI-powered threats.  

That’s why Darktrace publishes this research every year. The State of AI Cybersecurity 2026 provides an annual snapshot of how the AI threat landscape is shifting, where organizations are adopting AI to maximum advantage, and how they are securing AI in the enterprise.

What is the State of AI Cybersecurity 2026?

We surveyed over 1,500 CISOs, IT leaders, administrators, and practitioners from a range of industries and different countries to uncover their attitudes, understanding, and priorities when it comes to AI threats, agents, tools, and operations in 2026. ​

The results show a fast-changing picture, as security leaders race to navigate the challenges and opportunities at play. Since last year, there has been enormous progress towards maturity in areas like AI literacy and confidence in AI-powered defense, while issues around AI governance remain inconclusive.

Let’s look at some of the key findings for 2026.

What’s the impact of AI on the attack surface?

Security leaders are seeing the adoption of AI agents across the workforce, and are increasingly concerned about the security implications.

  • 44% are extremely or very concerned with the security implications of third-party LLMs (like Copilot or ChatGPT)
  • 92% are concerned about the use of AI agents across the workforce and their impact on security

The rapid expansion of generative AI across the enterprise is outpacing the security frameworks designed to govern it. AI systems behave in ways that traditional defenses are not designed to monitor, introducing new risks around data exposure, unauthorized actions, and opaque decision-making as employees embed generative AI and autonomous agents into everyday workflows.  

Their top concerns? Sensitive data exposure ranks top (61%), while regulatory compliance violations are a close second (56%). These risks tend to have the fastest and most material fallout – ranging from fines to reputational harm – and are more likely to materialize in environments where AI governance is still evolving.

What’s the impact of AI on the cyber threat landscape?

AI is now being used to expedite every stage of the attack kill chain – from initial intrusion to privilege escalation and data exfiltration. 

“73% say that AI-powered threats are already having a significant impact on their organization.”

With AI, attackers can launch novel attacks at scale, and this is significantly increasing the number of threats requiring attention by the security team – often to the point of overwhelm.  

Traditional security solutions relying on historical attack data were never designed to handle an environment where attacks continuously evolve, multiply, and optimize at machine speed, so it’s no surprise that 92% agree that AI-powered cyber-threats are forcing them to significantly upgrade their defenses.

How is AI reshaping cybersecurity operations?

Cybersecurity workflows are still in flux as security leaders get used to the integration of AI agents into everyday operations.  

“Generative AI is now playing a role in 77% of security stacks.” But only 35% are using unsupervised machine learning.

AI technologies are diverse, ranging from LLMs to NLP systems, GANs, and unsupervised machine learning, with each type offering specific capabilities and facing particular limitations. The lack of familiarity with the different types of AI used within the security stack may be holding some practitioners back from using these new technologies to their best advantage.  

It also creates a lack of trust between humans and AI systems: only 14% of security professionals allow AI to take independent remediation actions in the SOC with no human in the loop.

Another new trend for this year is a strong preference (85%) for relying on Managed Security Service Providers (MSSPs) for SOC services instead of in-house teams, as organizations aim to secure expert, always-on support without the cost and operational burden of running an internal operation.

What impact is AI having on cybersecurity tools?

“96% of cybersecurity professionals agree that AI can significantly improve the speed and efficiency with which they work.”

The capacity of AI for augmenting security efforts is undisputed. But as vendor AI claims become far-reaching, it falls to security leaders to clarify which AI tools offer true value and can help solve their specific security challenges.  

Security professionals are aligned on the biggest area of impact: 72% agree that AI excels at detecting anomalies thanks to its advanced pattern recognition. This enables it to identify unusual behavior that may signal a threat, even when the specific attack has never been encountered or recorded in existing datasets.  

“When purchasing new security capabilities, 93% prefer ones that are part of a broader platform over individual point products.”

Like last year, the drive towards platform consolidation remains strong. Fewer vendors can mean tighter integrations, less console switching, streamlined management, and stronger cross-domain threat insights. The challenge is finding vendors that perform well across the board.

See the full report for more statistics and insights into how security leaders are responding to the AI landscape in 2026.

Learn more about securing AI in your enterprise.

Continue reading
About the author
The Darktrace Community
あなたのデータ × DarktraceのAI
唯一無二のDarktrace AIで、ネットワークセキュリティを次の次元へ