ブログ
/
Endpoint
/
December 12, 2022

ML Integration for Third-Party EDR Alerts

The advantages and benefits of combining EDR technologies with Darktrace: how this integration can enhance your cybersecurity strategy.
Inside the SOC
Darktrace cyber analysts are world-class experts in threat intelligence, threat hunting and incident response, and provide 24/7 SOC support to thousands of Darktrace customers around the globe. Inside the SOC is exclusively authored by these experts, providing analysis of cyber incidents and threat trends, based on real-world experience in the field.
Written by
Max Heinemeyer
Global Field CISO
Default blog imageDefault blog imageDefault blog imageDefault blog imageDefault blog imageDefault blog image
12
Dec 2022

This blog demonstrates how we use EDR integration in Darktrace for detection & investigation. We’ll look at four key features, which are summarized with an example below:  

1)    Contextualizing existing Darktrace information – E.g. ‘There was a Microsoft Defender for Endpoint (MDE) alert 5 minutes after Darktrace saw the device beacon to an unusual destination on the internet. Let me pivot back into the Defender UI’
2)    Cross-data detection engineering
‘Darktrace, create an alert or trigger a response if you see a specific MDE alert and a native Darktrace detection on the same entity over a period of time’
3)    Applying unsupervised machine learning to third-party EDR alerts
‘Darktrace, create an alert or trigger a response if there is a specific MDE alert that is unusual for the entity, given the context’
4)    Use third-party EDR alerts to trigger AI Analyst
‘AI Analyst, this low-fidelity MDE alert flagged something on the endpoint. Please take a deep look at that device at the time of the Defender alert, conduct an investigation on Darktrace data and share your conclusions about whether there is more to it or not’ 

MDE is used as an example above, but Darktrace’s EDR integration capabilities extend beyond MDE to other EDRs as well, for example to Sentinel One and CrowdStrike EDR.

Darktrace brings its Self-Learning AI to your data, no matter where it resides. The data can be anywhere – in email environments, cloud, SaaS, OT, endpoints, or the network, for example. Usually, we want to get as close to the raw data as possible to get the maximum context for our machine learning. 

We will explain how we leverage high-value integrations from our technology partners to bring further context to Darktrace, but also how we apply our Self-Learning AI to third-party data. While there are a broad range of integrations and capabilities available, we will primarily look at Microsoft Defender for Endpoint, CrowdStrike, and SentinelOne and focus on detection in this blog post. 

The Nuts and Bolts – Setting up the Integration

Darktrace is an open platform – almost everything it does is API-driven. Our system and machine learning are flexible enough to ingest new types of data & combine it with already existing information.  

The EDR integrations mentioned here are part of our 1-click integrations. All it requires is the right level of API access from the EDR solutions and the ability for Darktrace to communicate with the EDR’s API. This type of integration can be setup within minutes – it currently doesn’t require additional Darktrace licenses.

Figure 1: Set-up of Darktrace Graph Security API integration

As soon as the setup is complete, it enables various additional capabilities. 
Let’s look at some of the key detection & investigation-focussed capabilities step-by-step.

Contextualizing Existing Darktrace Information

The most basic, but still highly-useful integration is enriching existing Darktrace information with EDR alerts. Darktrace shows a chronological history of associated telemetry and machine learning for each entity observed in the entities event log. 

With an EDR integration enabled, we now start to see EDR alerts for the respective entities turn up in the entity’s event log at the correct point in time – with a ton of context and a 1-click pivot back to the native EDR console: 

Figure 2: A pivot from the Darktrace Threat Visualizer to Microsoft Defender

This context is extremely useful to have in a single screen during investigations. Context is king – it reduces time-to-meaning and skill required to understand alerts.

Cross-Data Detection Engineering

When an EDR integration is activated, Darktrace enables an additional set of detections that leverage the new EDR alerts. This comes out of the box and doesn’t require any further detection engineering. It is worth mentioning though that the new EDR information is being made available in the background for bespoke detection engineering, if advanced users want to leverage these as custom metrics.

The trick here is that the added context provided by the additional EDR alerts allows for more refined detections – primarily to detect malicious activity with higher confidence. A network detection showing us beaconing over an unusual protocol or port combination to a rare destination on the internet is great – but seeing within Darktrace that CrowdStrike detected a potentially hostile file or process three minutes prior to the beaconing detection on the same device will greatly help to prioritize the detections and aid a subsequent investigation.

Here is an example of what this looks like in Darktrace:

Figure 3: A combined model breach in the Threat Visualizer

Applying Unsupervised Machine Learning to Third-Party EDR Alerts


Once we start seeing EDR alerts in Darktrace, we can start treating it like any other data – by applying unsupervised machine learning to it. This means we can then understand how unusual a given EDR detection is for each device in question. This is extremely powerful – it allows to reduce noisy alerts without requiring ongoing EDR alert tuning and opens a whole world of new detection capabilities.

As an example – let’s imagine a low-level malware alert keeps appearing from the EDR on a specific device. This might be a false-positive in the EDR, or just not of interest for the security team, but they may not have the resources or knowledge to further tune their EDR and get rid of this noisy alert.

While Darktrace keeps adding this as contextual information in the device’s event log, it could, depending on the context of the device, the EDR alert, and the overall environment, stop alerting on this particular EDR malware alert on this specific device if it stops being unusual. Over time, noise is reduced across the environment – but if that particular EDR alert appears on another device, or on the same device in a different context, it might get flagged again, as it now is unusual in the given context.

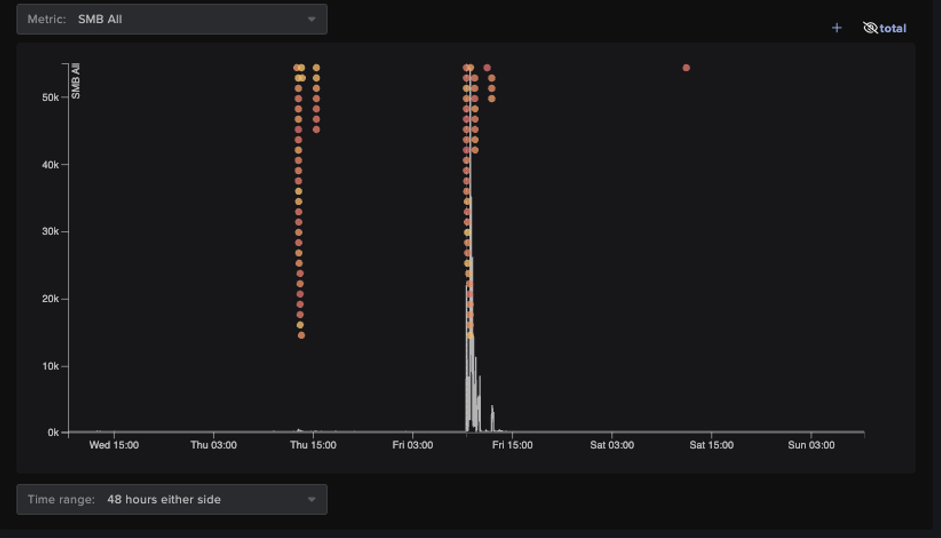
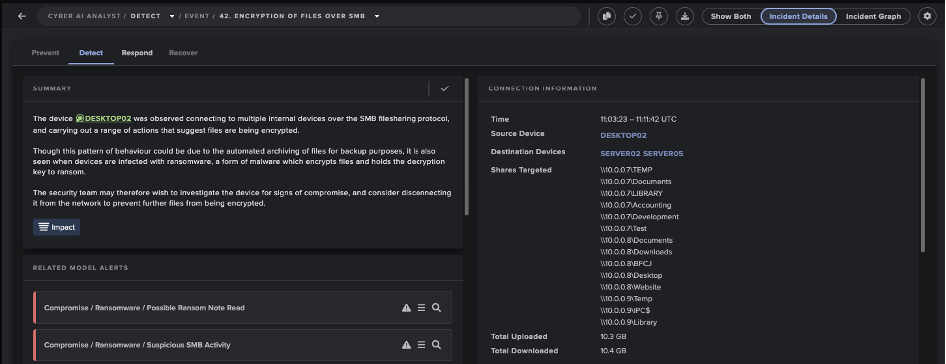
Darktrace then goes a step further, taking those unusual EDR alerts and combining them with unusual activity seen in other Darktrace coverage areas, like the network for example. Combining an unusual EDR alert with an unusual lateral movement attempt, for example, allows it to find these combined, high-precision, cross-data set anomalous events that are highly indicative of an active cyber-attack – without having to pre-define the exact nature of what ‘unusual’ looks like.

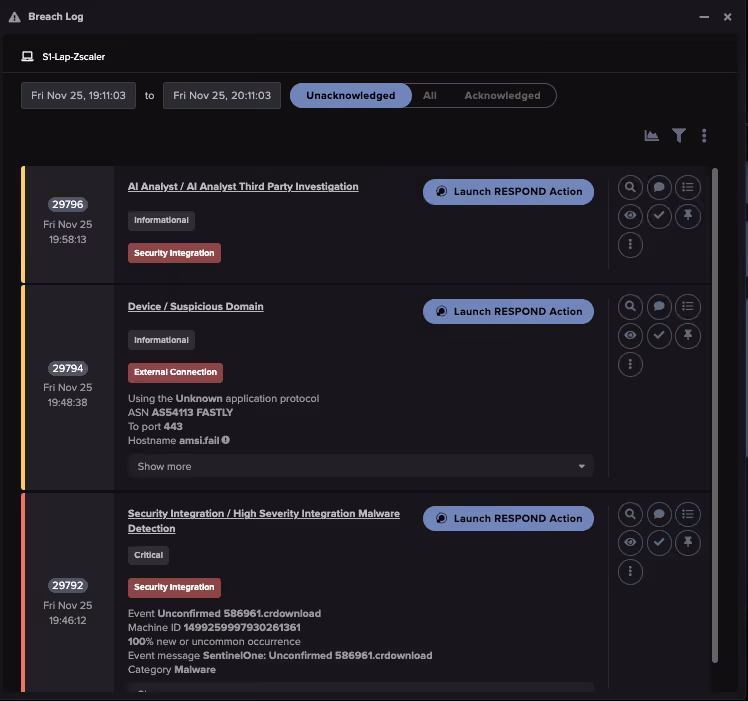
Figure 4: Combined EDR & network detection using unsupervised machine learning in Darktrace

Use Third-Party EDR Alerts to Trigger AI Analyst

Everything we discussed so far is great for improving precision in initial detections, adding context, and cutting through alert-noise. We don’t stop there though – we can also now use the third-party EDR alerts to trigger our investigation engine, the AI Analyst.

Cyber AI Analyst replicates and automates typical level 1 and level 2 Security Operations Centre (SOC) workflows. It is usually triggered by every native Darktrace detection. This is not a SOAR where playbooks are statically defined – AI Analyst builds hypotheses, gathers data, evaluates the data & reports on its findings based on the context of each individual scenario & investigation. 

Darktrace can use EDR alerts as starting points for its investigation, with every EDR alert ingested now triggering AI Analyst. This is similar to giving a (low-level) EDR alert to a human analyst and telling them: ‘Go and take a look at information in Darktrace and try to conclude whether there is more to this EDR alert or not.’

The AI Analyst subsequently looks at the entity which had triggered the EDR alert and investigates all available Darktrace data on that entity, over a period of time, in light of that EDR alert. It does not pivot outside Darktrace itself for that investigation (e.g. back into the Microsoft console) but looks at all of the context natively available in Darktrace. If concludes that there is more to this EDR alert – e.g. a bigger incident – it will report on that and clearly flag it. The report can of course be directly downloaded as a PDF to be shared with other stakeholders.

This comes in handy for a variety of reasons – primarily to further automate security operations and alleviate pressure from human teams. AI Analyst’s investigative capabilities sit on top of everything we discussed so far (combining EDR detections with detections from other coverage areas, applying unsupervised machine learning to EDR detections, …).

However, it can also come in handy to follow up on low-severity EDR alerts for which you might not have the human resources to do so.

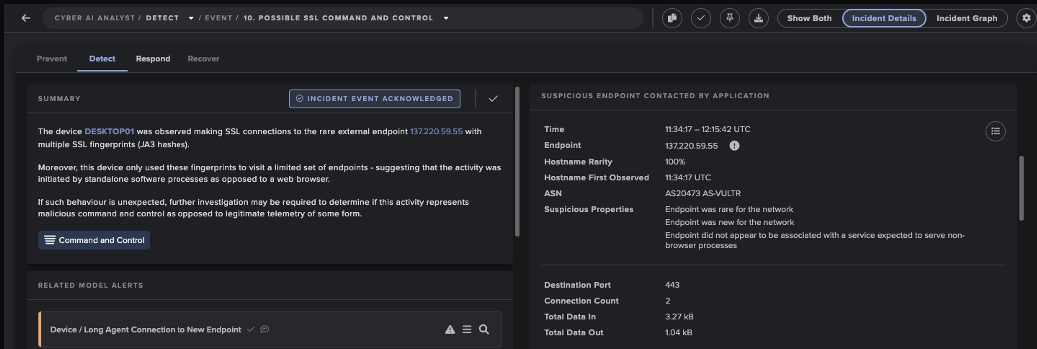
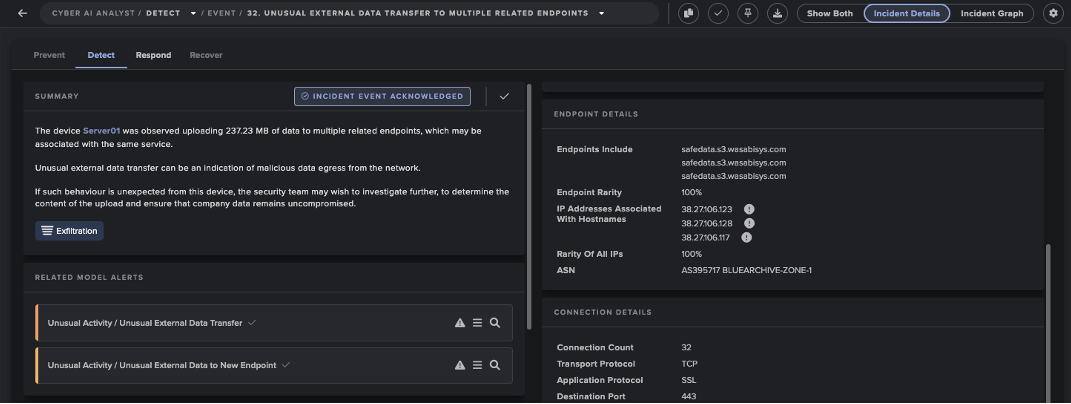
The below screenshot shows an example of a concluded AI Analyst investigation that was triggered by an EDR alert:

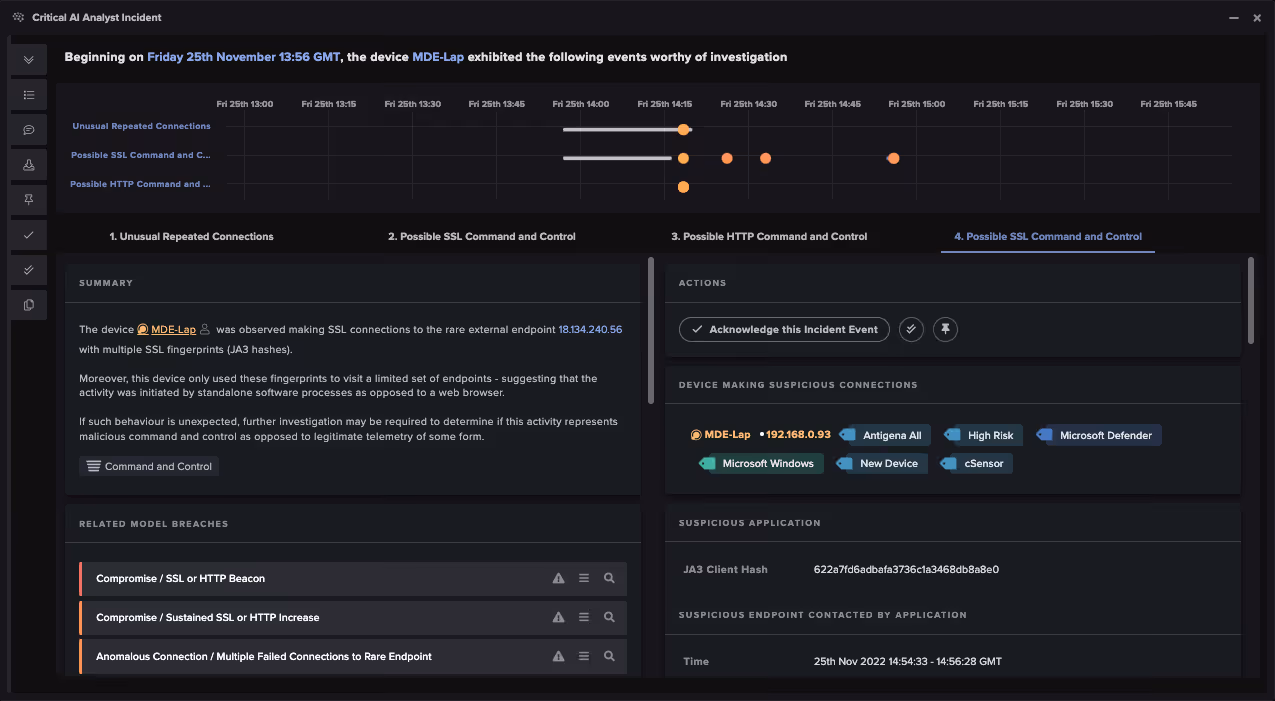
Figure 5: An AI Analyst incident trained on third-party data

The Impact of EDR Integrations

The purpose behind all of this is to augment human teams, save them time and drive further security automation.

By ingesting third-party endpoint alerts, combining it with our existing intelligence and applying unsupervised machine learning to it, we achieve that further security automation. 

Analysts don’t have to switch between consoles for investigations. They can leverage our high-fidelity detections that look for unusual endpoint alerts, in combination with our already powerful detections across cloud and email systems, zero trust architecture, IT and OT networks, and more. 

In our experience, this pinpoints the needle in the haystack – it cuts through noise and reduces the mean-time-to-detect and mean-time-to-investigate drastically.

All of this is done out of the box in Darktrace once the endpoint integrations are enabled. It does not need a data scientist to make the machine learning work. Nor does it need a detection engineer or threat hunter to create bespoke, meaningful detections. We want to reduce the barrier to entry for using detection and investigation solutions – in terms of skill and experience required. The system is still flexible, transparent, and open, meaning that advanced users can create their own combined detections, leveraging unsupervised machine learning across different data sets with a few clicks.

There are of course more endpoint integration capabilities available than what we covered here, and we will explore these in future blog posts.

Inside the SOC
Darktrace cyber analysts are world-class experts in threat intelligence, threat hunting and incident response, and provide 24/7 SOC support to thousands of Darktrace customers around the globe. Inside the SOC is exclusively authored by these experts, providing analysis of cyber incidents and threat trends, based on real-world experience in the field.
Written by
Max Heinemeyer
Global Field CISO

More in this series

No items found.

Blog

/

Cloud

/

March 5, 2026

Inside Cloud Compromise: Investigating Attacker Activity with Darktrace / Forensic Acquisition & Investigation

Default blog imageDefault blog image

Investigating Cloud Attacks with Forensic Acquisition & Investigation

Darktrace / Forensic Acquisition & Investigation™ is the industry’s first truly automated forensic solution purpose-built for the cloud. This blog will demonstrate how an investigation can be carried out against a compromised cloud server in minutes, rather than hours or days.

The compromised server investigated in this case originates from Darktrace’s Cloudypots system, a global honeypot network designed to observe adversary activity in real time across a wide range of cloud services. Whenever an attacker successfully compromises one of these honeypots, a forensic copy of the virtual server's disk is preserved for later analysis. Using Forensic Acquisition & Investigation, analysts can then investigate further and obtain detailed insights into the compromise including complete attacker timelines and root cause analysis.

Forensic Acquisition & Investigation supports importing artifacts from a variety of sources, including EC2 instances, ECS, S3 buckets, and more. The Cloudypots system produces a raw disk image whenever an attack is detected and stores it in an S3 bucket. This allows the image to be directly imported into Forensic Acquisition & Investigation using the S3 bucket import option.

As Forensic Acquisition & Investigation runs cloud-natively, no additional configuration is required to add a specific S3 bucket. Analysts can browse and acquire forensic assets from any bucket that the configured IAM role is permitted to access. Operators can also add additional IAM credentials, including those from other cloud providers, to extend access across multiple cloud accounts and environments.

Figure 1: Forensic Acquisition & Investigation import screen.

Forensic Acquisition & Investigation then retrieves a copy of the file and automatically begins running the analysis pipeline on the artifact. This pipeline performs a full forensic analysis of the disk and builds a timeline of the activity that took place on the compromised asset. By leveraging Forensic Acquisition & Investigation’s cloud-native analysis system, this process condenses hour of manual work into just minutes.

Successful import of a forensic artifact and initiation of the analysis pipeline.
Figure 2: Successful import of a forensic artifact and initiation of the analysis pipeline.

Once processing is complete, the preserved artifact is visible in the Evidence tab, along with a summary of key information obtained during analysis, such as the compromised asset’s hostname, operating system, cloud provider, and key event count.

The Evidence overview showing the acquired disk image.
Figure 3: The Evidence overview showing the acquired disk image.

Clicking on the “Key events” field in the listing opens the timeline view, automatically filtered to show system- generated alarms.

The timeline provides a chronological record of every event that occurred on the system, derived from multiple sources, including:

  • Parsed log files such as the systemd journal, audit logs, application specific logs, and others.
  • Parsed history files such as .bash_history, allowing executed commands to be shown on the timeline.
  • File-specific events, such as files being created, accessed, modified, or executables being run, etc.

This approach allows timestamped information and events from multiple sources to be aggregated and parsed into a single, concise view, greatly simplifying the data review process.

Alarms are created for specific timeline events that match either a built-in system rule, curated by Darktrace’s Threat Research team or an operator-defined created at the project level. These alarms help quickly filter out noise and highlight on events of interest, such as the creation of a file containing known malware, access to sensitive files like Amazon Web Service (AWS) credentials, suspicious arguments or commands, and more.

 The timeline view filtered to alarm_severity: “1” OR alarm_severity: “3”, showing only events that matched an alarm rule.
Figure 4: The timeline view filtered to alarm_severity: “1” OR alarm_severity: “3”, showing only events that matched an alarm rule.

In this case, several alarms were generated for suspicious Base64 arguments being passed to Selenium. Examining the event data, it appears the attacker spawned a Selenium Grid session with the following payload:

"request.payload": "[Capabilities {browserName: chrome, goog:chromeOptions: {args: [-cimport base64;exec(base64...], binary: /usr/bin/python3, extensions: []}, pageLoadStrategy: normal}]"

This is a common attack vector for Selenium Grid. The chromeOptions object is intended to specify arguments for how Google Chrome should be launched; however, in this case the attacker has abused the binary field to execute the Python3 binary instead of Chrome. Combined with the option to specify command-line arguments, the attacker can use Python3’s -c option to execute arbitrary Python code, in this instance, decoding and executing a Base64 payload.

Selenium’s logs truncate the Arguments field automatically, so an alternate method is required to retrieve the full payload. To do this, the search bar can be used to find all events that occurred around the same time as this flagged event.

Pivoting off the previous event by filtering the timeline to events within the same window using timestamp: [“2026-02-18T09:09:00Z” TO “2026-02-18T09:12:00Z”].
Figure 5: Pivoting off the previous event by filtering the timeline to events within the same window using timestamp: [“2026-02-18T09:09:00Z” TO “2026-02-18T09:12:00Z”].

Scrolling through the search results, an entry from Java’s systemd journal can be identified. This log contains the full, unaltered payload. GCHQ’s CyberChef can then be used to decode the Base64 data into the attacker’s script, which will ultimately be executed.[NJ9]

Continue reading
About the author
Nathaniel Bill
Malware Research Engineer

Blog

/

Network

/

February 19, 2026

CVE-2026-1731: How Darktrace Sees the BeyondTrust Exploitation Wave Unfolding

Default blog imageDefault blog image

Note: Darktrace's Threat Research team is publishing now to help defenders. We will continue updating this blog as our investigations unfold.

Background

On February 6, 2026, the Identity & Access Management solution BeyondTrust announced patches for a vulnerability, CVE-2026-1731, which enables unauthenticated remote code execution using specially crafted requests.  This vulnerability affects BeyondTrust Remote Support (RS) and particular older versions of Privileged Remote Access (PRA) [1].

A Proof of Concept (PoC) exploit for this vulnerability was released publicly on February 10, and open-source intelligence (OSINT) reported exploitation attempts within 24 hours [2].

Previous intrusions against Beyond Trust technology have been cited as being affiliated with nation-state attacks, including a 2024 breach targeting the U.S. Treasury Department. This incident led to subsequent emergency directives from  the Cybersecurity and Infrastructure Security Agency (CISA) and later showed attackers had chained previously unknown vulnerabilities to achieve their goals [3].

Additionally, there appears to be infrastructure overlap with React2Shell mass exploitation previously observed by Darktrace, with command-and-control (C2) domain  avg.domaininfo[.]top seen in potential post-exploitation activity for BeyondTrust, as well as in a React2Shell exploitation case involving possible EtherRAT deployment.

Darktrace Detections

Darktrace’s Threat Research team has identified highly anomalous activity across several customers that may relate to exploitation of BeyondTrust since February 10, 2026. Observed activities include:

Outbound connections and DNS requests for endpoints associated with Out-of-Band Application Security Testing; these services are commonly abused by threat actors for exploit validation.  Associated Darktrace models include:

  • Compromise / Possible Tunnelling to Bin Services

Suspicious executable file downloads. Associated Darktrace models include:

  • Anomalous File / EXE from Rare External Location

Outbound beaconing to rare domains. Associated Darktrace models include:

  • Compromise / Agent Beacon (Medium Period)
  • Compromise / Agent Beacon (Long Period)
  • Compromise / Sustained TCP Beaconing Activity To Rare Endpoint
  • Compromise / Beacon to Young Endpoint
  • Anomalous Server Activity / Rare External from Server
  • Compromise / SSL Beaconing to Rare Destination

Unusual cryptocurrency mining activity. Associated Darktrace models include:

  • Compromise / Monero Mining
  • Compromise / High Priority Crypto Currency Mining

And model alerts for:

  • Compromise / Rare Domain Pointing to Internal IP

IT Defenders: As part of best practices, we highly recommend employing an automated containment solution in your environment. For Darktrace customers, please ensure that Autonomous Response is configured correctly. More guidance regarding this activity and suggested actions can be found in the Darktrace Customer Portal.  

Appendices

Potential indicators of post-exploitation behavior:

·      217.76.57[.]78 – IP address - Likely C2 server

·      hXXp://217.76.57[.]78:8009/index.js - URL -  Likely payload

·      b6a15e1f2f3e1f651a5ad4a18ce39d411d385ac7  - SHA1 - Likely payload

·      195.154.119[.]194 – IP address – Likely C2 server

·      hXXp://195.154.119[.]194/index.js - URL – Likely payload

·      avg.domaininfo[.]top – Hostname – Likely C2 server

·      104.234.174[.]5 – IP address - Possible C2 server

·      35da45aeca4701764eb49185b11ef23432f7162a – SHA1 – Possible payload

·      hXXp://134.122.13[.]34:8979/c - URL – Possible payload

·      134.122.13[.]34 – IP address – Possible C2 server

·      28df16894a6732919c650cc5a3de94e434a81d80 - SHA1 - Possible payload

References:

1.        https://nvd.nist.gov/vuln/detail/CVE-2026-1731

2.        https://www.securityweek.com/beyondtrust-vulnerability-targeted-by-hackers-within-24-hours-of-poc-release/

3.        https://www.rapid7.com/blog/post/etr-cve-2026-1731-critical-unauthenticated-remote-code-execution-rce-beyondtrust-remote-support-rs-privileged-remote-access-pra/

Continue reading
About the author
Emma Foulger
Global Threat Research Operations Lead
あなたのデータ × DarktraceのAI
唯一無二のDarktrace AIで、ネットワークセキュリティを次の次元へ