ブログ
/
Network
/
February 3, 2026

Darktrace Malware Analysis: Unpacking SnappyBee

his blog details how to unpack malware like SnappyBee, a modular backdoor linked to Salt Typhoon, revealing its custom packing, DLL sideloading, dynamic API resolution, and multi‑stage in‑memory decryption. It provides analysts with a step‑by‑step guide to extract hidden payloads and understand advanced evasion techniques by sophisticated malware strains.
Inside the SOC
Darktrace cyber analysts are world-class experts in threat intelligence, threat hunting and incident response, and provide 24/7 SOC support to thousands of Darktrace customers around the globe. Inside the SOC is exclusively authored by these experts, providing analysis of cyber incidents and threat trends, based on real-world experience in the field.
Written by
Nathaniel Bill
Malware Research Engineer
Default blog image
03
Feb 2026

Introduction

The aim of this blog is to be an educational resource, documenting how an analyst can perform malware analysis techniques such as unpacking. This blog will demonstrate the malware analysis process against well-known malware, in this case SnappyBee.

SnappyBee (also known as Deed RAT) is a modular backdoor that has been previously attributed to China-linked cyber espionage group Salt Typhoon, also known as Earth Estries [1] [2]. The malware was first publicly documented by TrendMicro in November 2024 as part of their investigation into long running campaigns targeting various industries and governments by China-linked threat groups.

In these campaigns, SnappyBee is deployed post-compromise, after the attacker has already obtained access to a customer's system, and is used to establish long-term persistence as well as deploying further malware such as Cobalt Strike and the Demodex rootkit.

To decrease the chance of detection, SnappyBee uses a custom packing routine. Packing is a common technique used by malware to obscure its true payload by hiding it and then stealthily loading and executing it at runtime. This hinders analysis and helps the malware evade detection, especially during static analysis by both human analysts and anti-malware services.

This blog is a practical guide on how an analyst can unpack and analyze SnappyBee, while also learning the necessary skills to triage other malware samples from advanced threat groups.

First principles

Packing is not a new technique, and threat actors have generally converged on a standard approach. Packed binaries typically feature two main components: the packed data and an unpacking stub, also called a loader, to unpack and run the data.

Typically, malware developers insert a large blob of unreadable data inside an executable, such as in the .rodata section. This data blob is the true payload of the malware, but it has been put through a process such as encryption, compression, or another form of manipulation to render it unreadable. Sometimes, this data blob is instead shipped in a different file, such as a .dat file, or a fake image. When this happens, the main loader has to read this using a syscall, which can be useful for analysis as syscalls can be easily identified, even in heavily obfuscated binaries.

In the main executable, malware developers will typically include an unpacking stub that takes the data blob, performs one or more operations on it, and then triggers its execution. In most samples, the decoded payload data is loaded into a newly allocated memory region, which will then be marked as executable and executed. In other cases, the decoded data is instead dropped into a new executable on disk and run, but this is less common as it increases the likelihood of detection.

Finding the unpacking routine

The first stage of analysis is uncovering the unpacking routine so it can be reverse engineered. There are several ways to approach this, but it is traditionally first triaged via static analysis on the initial stages available to the analyst.

SnappyBee consists of two components that can be analyzed:

  • A Dynamic-link Library (DLL) that acts as a loader, responsible for unpacking the malicious code
  • A data file shipped alongside the DLL, which contains the encrypted malicious code

Additionally, SnappyBee includes a legitimate signed executable that is vulnerable to DLL side-loading. This means that when the executable is run, it will inadvertently load SnappyBee’s DLL instead of the legitimate one it expects. This allows SnappyBee to appear more legitimate to antivirus solutions.

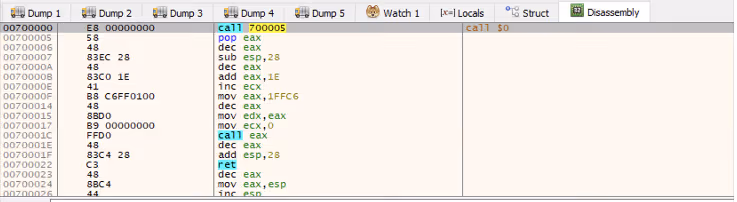
The first stage of analysis is performing static analysis of the DLL. This can be done by opening the DLL within a disassembler such as IDA Pro. Upon opening the DLL, IDA will display the DllMain function, which is the malware’s initial entry point and the first code executed when the DLL is loaded.

The DllMain function
Figure 1: The DllMain function

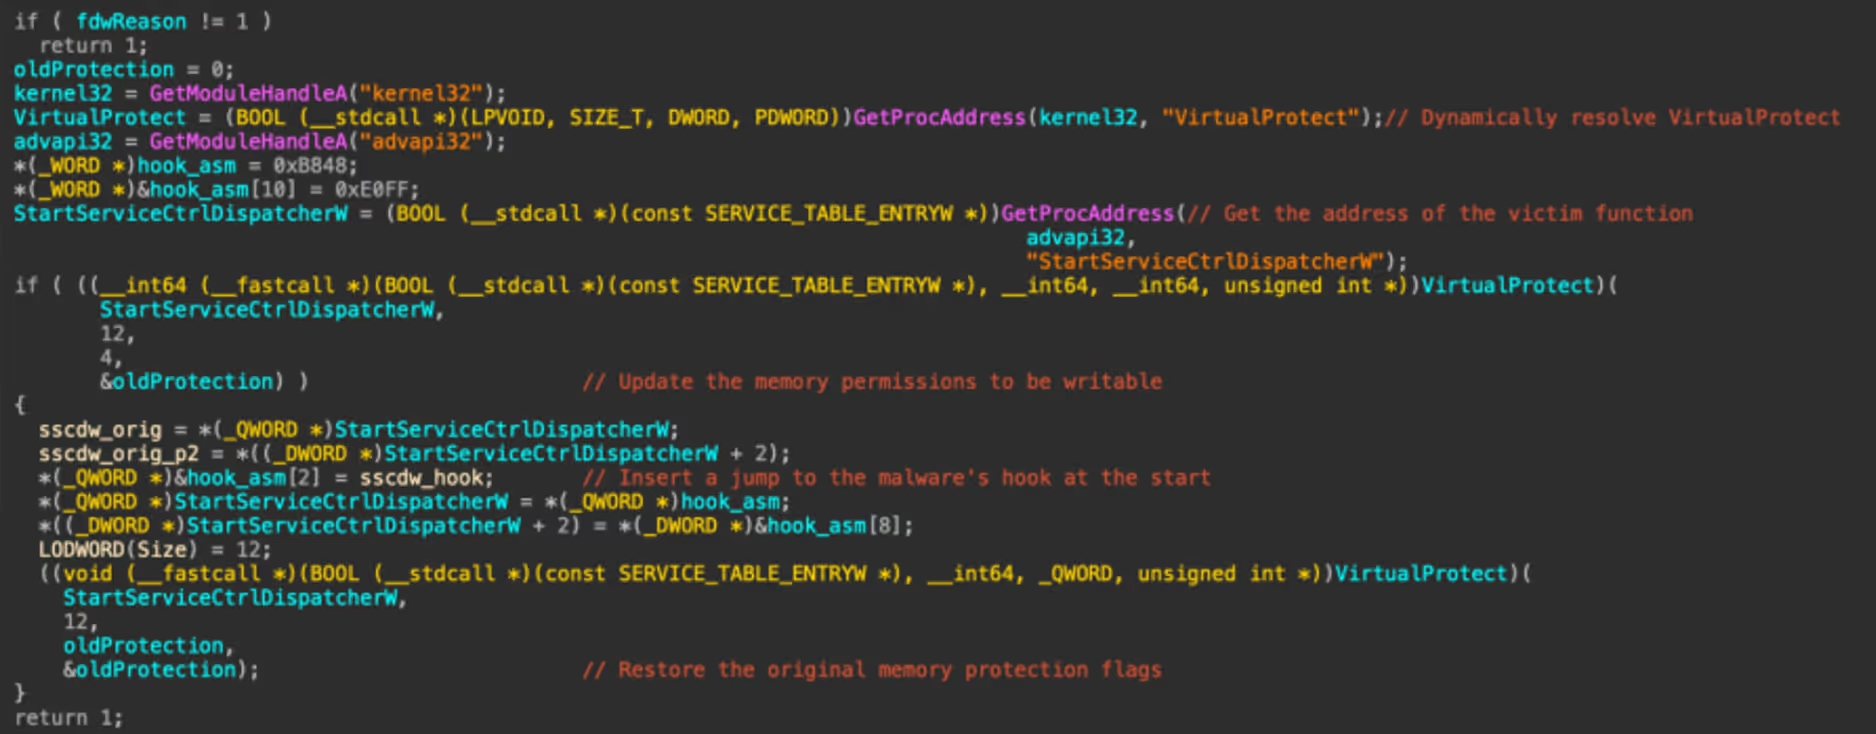
First, the function checks if the variable fdwReason is set to 1, and exits if it is not. This variable is set by Windows to indicate why the DLL was loaded. According to Microsoft Developer Network (MSDN), a value of 1 corresponds to DLL_PROCESS_ATTACH, meaning “The DLL is being loaded into the virtual address space of the current process as a result of the process starting up or as a result of a call to LoadLibrary” [3]. Since SnappyBee is known to use DLL sideloading for execution, DLL_PROCESS_ATTACH is the expected value when the legitimate executable loads the malicious DLL.

SnappyBee then uses the GetModule and GetProcAddress to dynamically resolve the address of the VirtualProtect in kernel32 and StartServiceCtrlDispatcherW in advapi32. Resolving these dynamically at runtime prevents them from showing up as a static import for the module, which can help evade detection by anti-malware solutions. Different regions of memory have different permissions to control what they can be used for, with the main ones being read, write, and execute. VirtualProtect is a function that changes the permissions of a given memory region.

SnappyBee then uses VirtualProtect to set the memory region containing the code for the StartServiceCtrlDispatcherW function as writable. It then inserts a jump instruction at the start of this function, redirecting the control flow to one of the SnappyBee DLL’s other functions, and then restores the old permissions.

In practice, this means when the legitimate executable calls StartServiceCtrlDispatcherW, it will immediately hand execution back to SnappyBee. Meanwhile, the call stack now appears more legitimate to outside observers such as antimalware solutions.

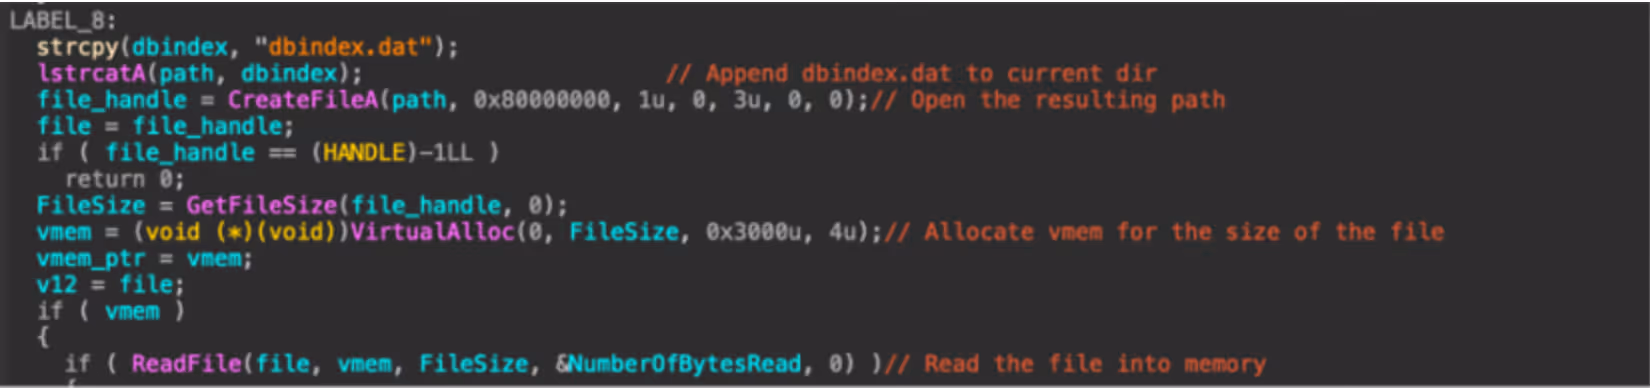
The hooked-in function then reads the data file that is shipped with SnappyBee and loads it into a new memory allocation. This pattern of loading the file into memory likely means it is responsible for unpacking the next stage.

The start of the unpacking routine that reads in dbindex.dat.
Figure 2: The start of the unpacking routine that reads in dbindex.dat.

SnappyBee then proceeds to decrypt the memory allocation and execute the code.

The memory decryption routine.
Figure 3: The memory decryption routine.

This section may look complex, however it is fairly straight forward. Firstly, it uses memset to zero out a stack variable, which will be used to store the decryption key. It then uses the first 16 bytes of the data file as a decryption key to initialize the context from.

SnappyBee then calls the mbed_tls_arc4_crypt function, which is a function from the mbedtls library. Documentation for this function can be found online and can be referenced to better understand what each of the arguments mean [4].

The documentation for mbedtls_arc4_crypt.
Figure 4: The documentation for mbedtls_arc4_ crypt.

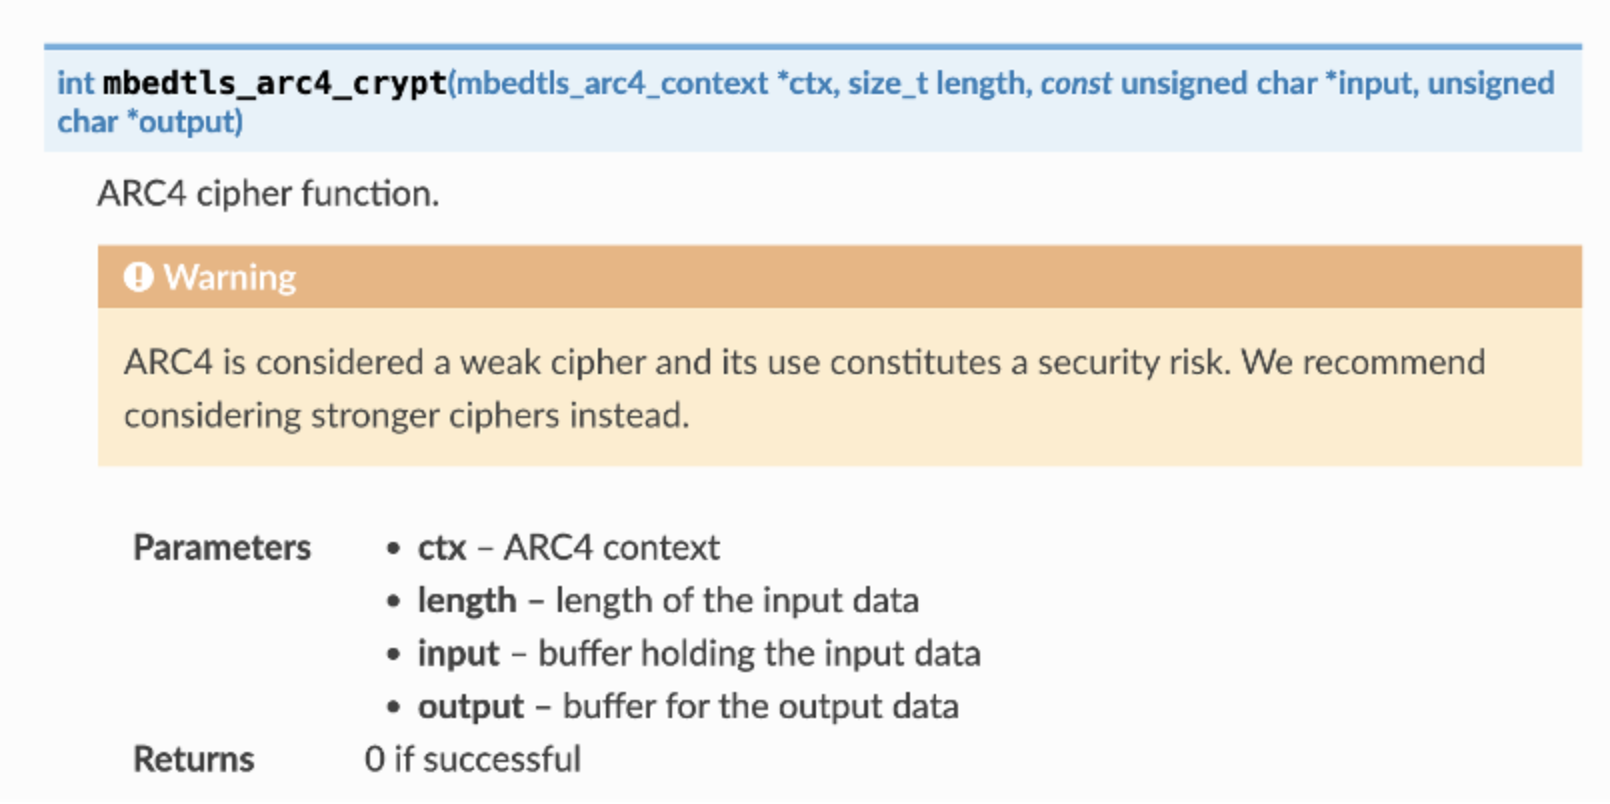
Comparing the decompilation with the documentation, the arguments SnappyBee passes to the function can be decoded as:

  • The context derived from 16-byte key at the start of the data is passed in as the context in the first parameter
  • The file size minus 16 bytes (to account for the key at the start of the file) is the length of the data to be decrypted
  • A pointer to the file contents in memory, plus 16 bytes to skip the key, is used as the input
  • A pointer to a new memory allocation obtained from VirtualAlloc is used as the output

So, putting it all together, it can be concluded that SnappyBee uses the first 16 bytes as the key to decrypt the data that follows , writing the output into the allocated memory region.

SnappyBee then calls VirtualProtect to set the decrypted memory region as Read + Execute, and subsequently executes the code at the memory pointer. This is clearly where the unpacked code containing the next stage will be placed.

Unpacking the malware

Understanding how the unpacking routine works is the first step. The next step is obtaining the actual code, which cannot be achieved through static analysis alone.

There are two viable methods to retrieve the next stage. The first method is implementing the unpacking routine from scratch in a language like Python and running it against the data file.

This is straightforward in this case, as the unpacking routine in relatively simple and would not require much effort to re-implement. However, many unpacking routines are far more complex, which leads to the second method: allowing the malware to unpack itself by debugging it and then capturing the result. This is the approach many analysts take to unpacking, and the following will document this method to unpack SnappyBee.

As SnappyBee is 32-bit Windows malware, debugging can be performed using x86dbg in a Windows sandbox environment to debug SnappyBee. It is essential this sandbox is configured correctly, because any mistake during debugging could result in executing malicious code, which could have serious consequences.

Before debugging, it is necessary to disable the DYNAMIC_BASE flag on the DLL using a tool such as setdllcharacteristics. This will stop ASLR from randomizing the memory addresses each time the malware runs and ensures that it matches the addresses observed during static analysis.

The first place to set a breakpoint is DllMain, as this is the start of the malicious code and the logical place to pause before proceeding. Using IDA, the functions address can be determined; in this case, it is at offset 10002DB0. This can be used in the Goto (CTRL+G) dialog to jump to the offset and place a breakpoint. Note that the “Run to user code” button may need to be pressed if the DLL has not yet been loaded by x32dbg, as it spawns a small process to load the DLL as DLLs cannot be executed directly.

The program can then run until the breakpoint, at which point the program will pause and code recognizable from static analysis can be observed.

Figure 5: The x32dbg dissassembly listing forDllMain.

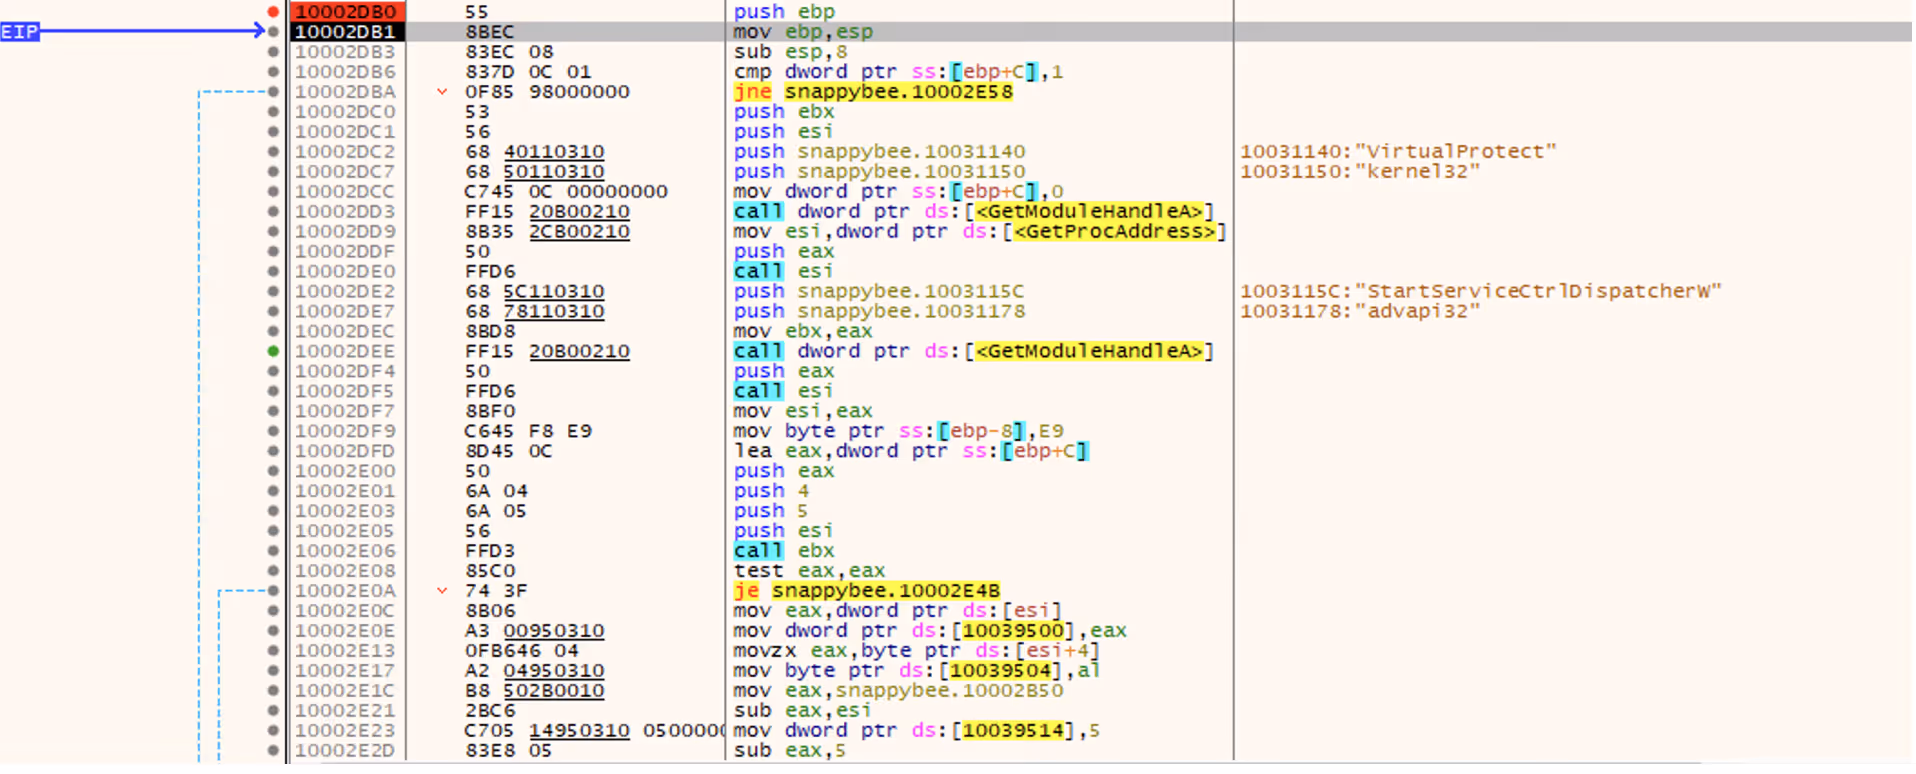
In the previous section, this function was noted as responsible for setting up a hook, and in the disassembly listing the hook address can be seen being loaded at offset 10002E1C. It is not necessary to go through the whole hooking process, because only the function that gets hooked in needs to be run. This function will not be naturally invoked as the DLL is being loaded directly rather than via sideloading as it expects. To work around this, the Extended Instruction Pointer (EIP) register can be manipulated to point to the start of the hook function instead, which will cause it to run instead of the DllMain function.

To update EIP, the CRTL+G dialog can again be used to jump to the hook function address (10002B50), and then the EIP register can be set to this address by right clicking the first instruction and selecting “Set EIP here”. This will make the hook function code run next.

Figure 6: The start of the hookedin-in function

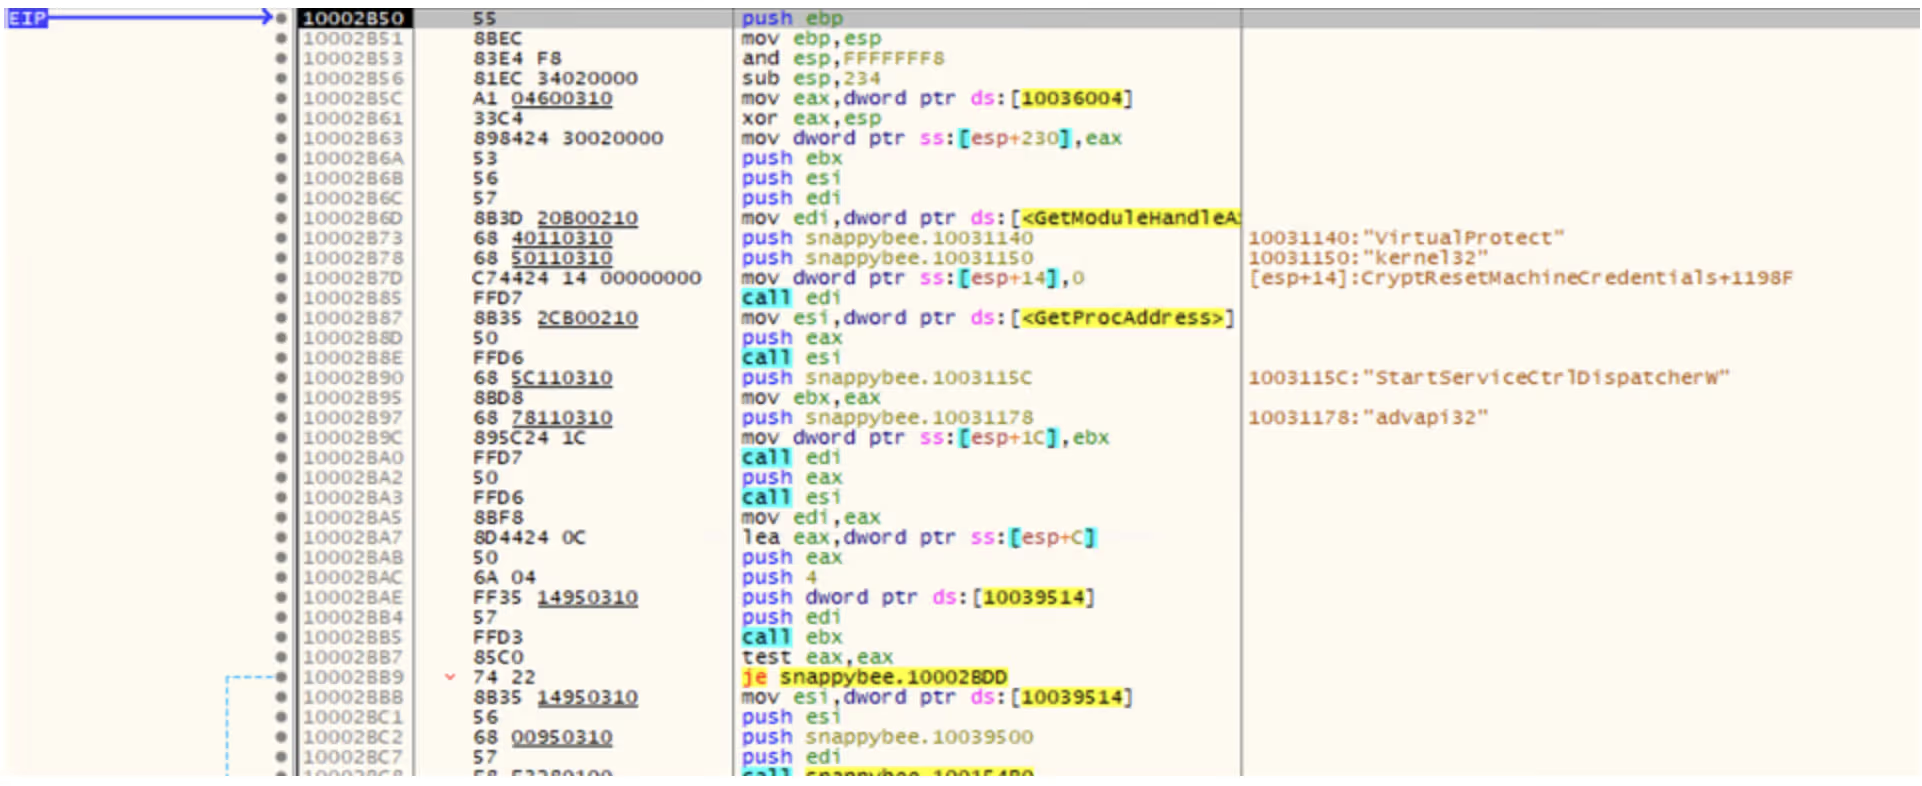
Once in this function, there are a few addresses where breakpoints should be set in order to inspect the state of the program at critical points in the unpacking process. These are:

-              10002C93, which allocates the memory for the data file and final code

-              10002D2D, which decrypts the memory

-              10002D81, which runs the unpacked code

Setting these can be done by pressing the dot next to the instruction listing, or via the CTRL+G Goto menu.

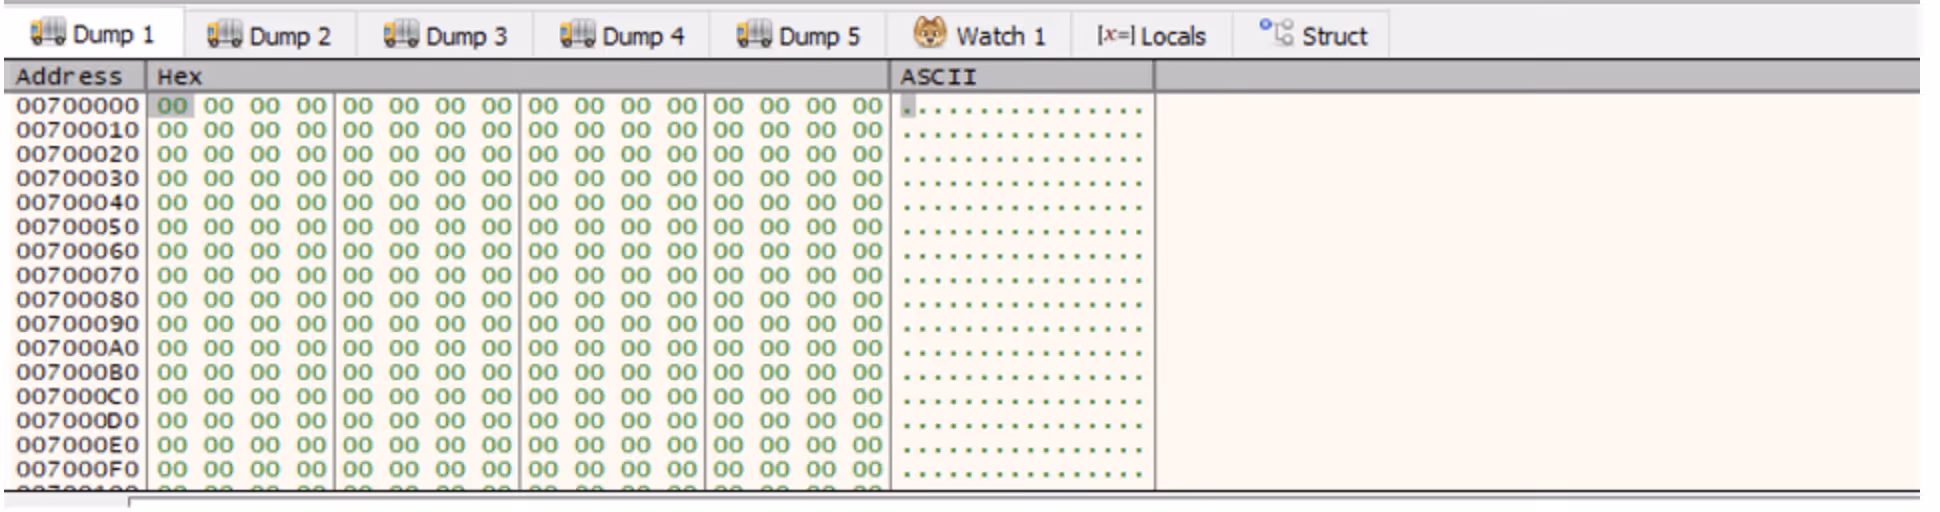
At the first breakpoint, the call to VirtualAlloc will be executed. The function returns the memory address of the created memory region, which is stored in the EAX register. In this case, the region was allocated at address 00700000.

Figure 7: The result of the VirtualAlloc call.

It is possible to right click the address and press “Follow in dump” to pin the contents of the memory to the lower pane, which makes it easy to monitor the region as the unpacking process continues.

Figure 8: The allocated memory region shown in x32dbg’s dump.

Single-stepping through the application from this point eventually reaches the call to ReadFile, which loads the file into the memory region.

Figure 9: The allocated memory region after the file is read into it, showing high entropy data.

The program can then be allowed to run until the next breakpoint, which after single-stepping will execute the call to mbedtls_arc4_crypt to decrypt the memory. At this point, the data in the dump will have changed.

Figure 10: The same memory region after the decryption is run, showing lower entropy data.

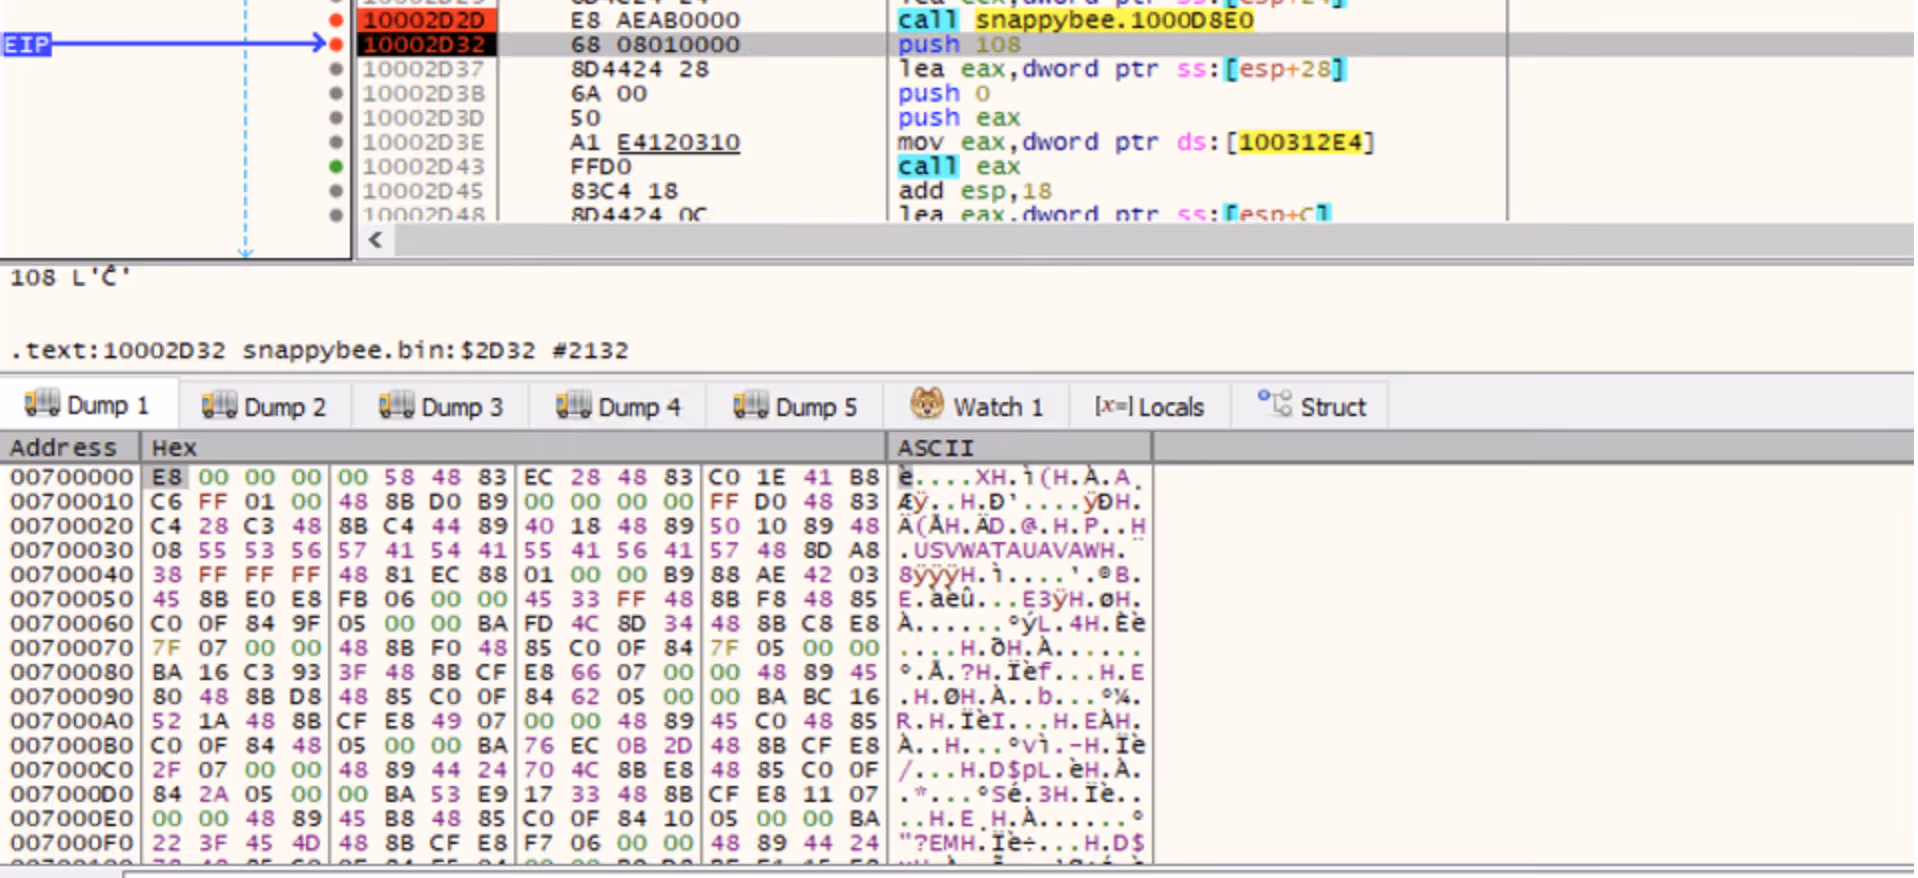
Right-clicking in the dump and selecting "Disassembly” will disassemble the data. This yields valid shell code, indicating that the unpacking succeeded, whereas corrupt or random data would be expected if the unpacking had failed.

Figure 11: The disassembly view of the allocated memory.

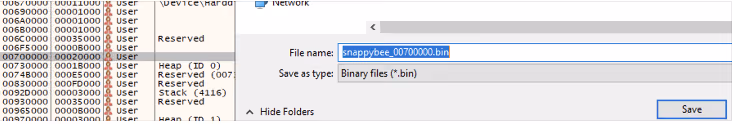
Right-clicking and selecting “Follow in memory map” will show the memory allocation under the memory map view. Right-clicking this then provides an option to dump the entire memory block to file.

Figure 12: Saving the allocated memory region.

This dump can then be opened in IDA, enabling further static analysis of the shellcode. Reviewing the shellcode, it becomes clear that it performs another layer of unpacking.

As the debugger is already running, the sample can be allowed to execute up to the final breakpoint that was set on the call to the unpacked shellcode. Stepping into this call will then allow debugging of the new shellcode.

The simplest way to proceed is to single-step through the code, pausing on each call instruction to consider its purpose. Eventually, a call instruction that points to one of the memory regions that were assigned will be reached, which will contain the next layer of unpacked code. Using the same disassembly technique as before, it can be confirmed that this is more unpacked shellcode.

Figure 13: The unpacked shellcode’s call to RDI, which points to more unpacked shellcode. Note this screenshot depicts the 64-bit variant of SnappyBee instead of 32-bit, however the theory is the same.

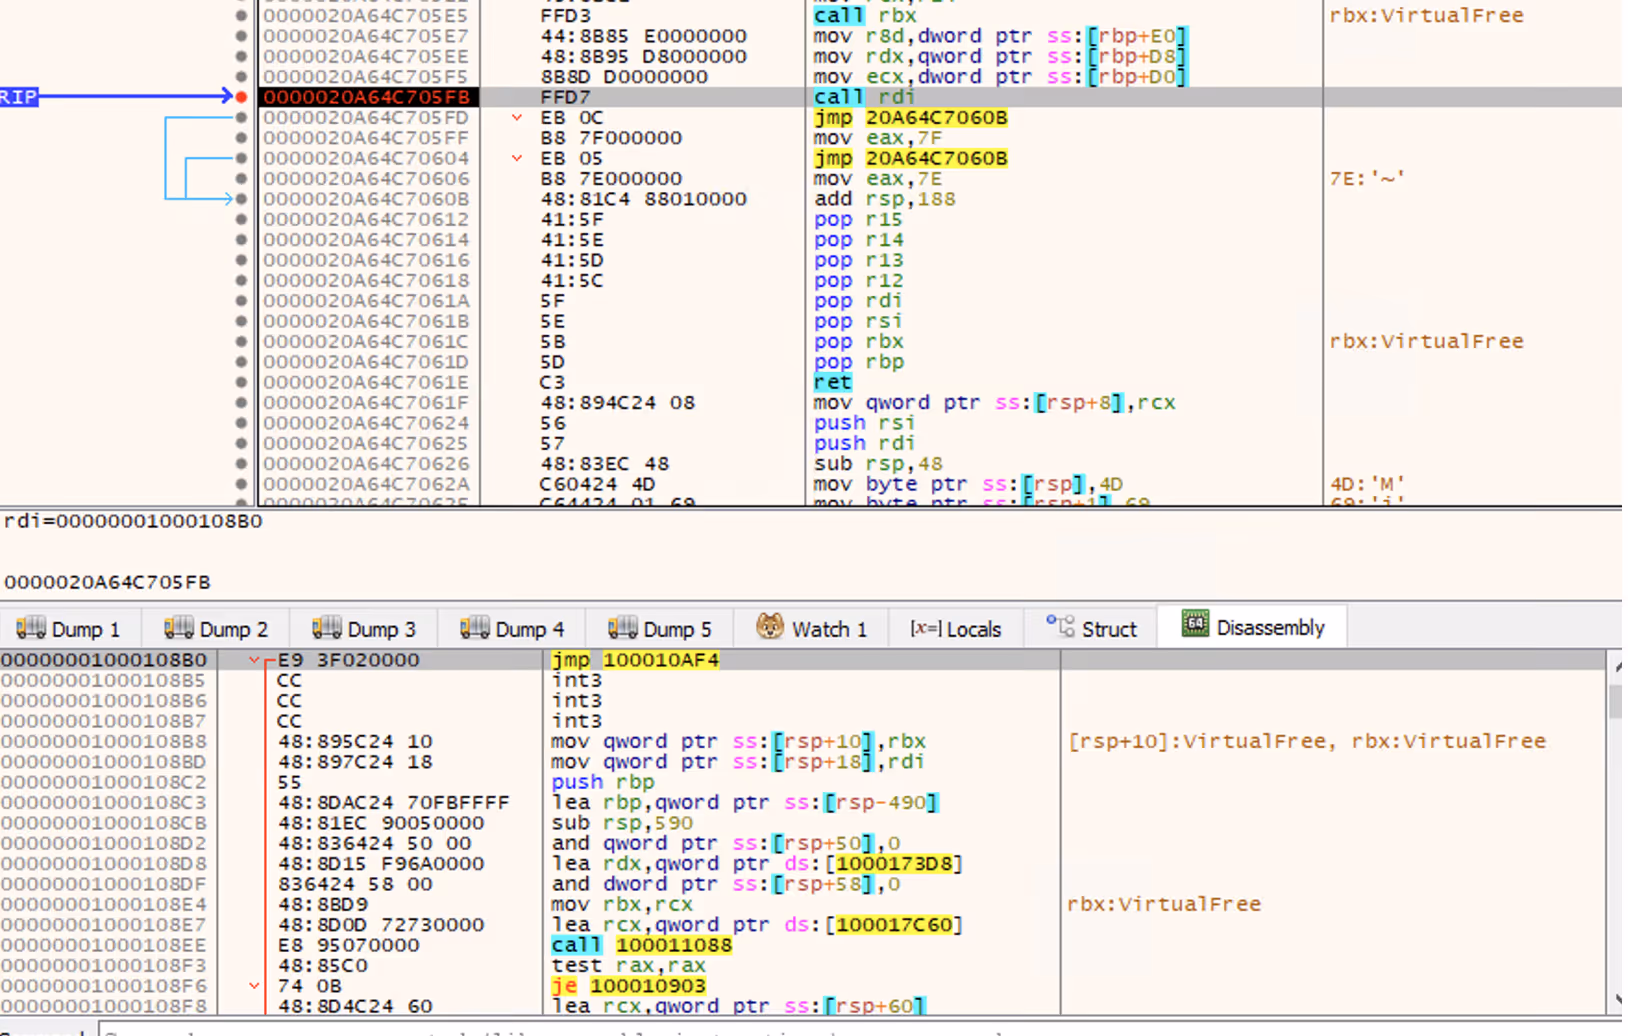
Once again, this can be dumped out and analyzed further in IDA. In this case, it is the final payload used by the SnappyBee malware.

Conclusion

Unpacking remains one of the most common anti-analysis techniques and is a feature of most sophisticated malware from threat groups. This technique of in-memory decryption reduces the forensic “surface area” of the malware, helping it to evade detection from anti-malware solutions. This blog walks through one such example and provides practical knowledge on how to unpack malware for deeper analysis.

In addition, this blog has detailed several other techniques used by threat actors to evade analysis, such as DLL sideloading to execute code without arising suspicion, dynamic API resolving to bypass static heuristics, and multiple nested stages to make analysis challenging.

Malware such as SnappyBee demonstrates a continued shift towards highly modular and low-friction malware toolkits that can be reused across many intrusions and campaigns. It remains vital for security teams  to maintain the ability to combat the techniques seen in these toolkits when responding to infections.

While the technical details of these techniques are primarily important to analysts, the outcomes of this work directly affect how a Security Operations Centre (SOC) operates at scale. Without the technical capability to reliably unpack and observe these samples, organizations are forced to respond without the full picture.

The techniques demonstrated here help close that gap. This enables security teams to reduce dwell time by understanding the exact mechanisms of a sample earlier, improve detection quality with behavior-based indicators rather than relying on hash-based detections, and increase confidence in response decisions when determining impact.

Credit to Nathaniel Bill (Malware Research Engineer)
Edited by Ryan Traill (Analyst Content Lead)

Indicators of Compromise (IoCs)

SnappyBee Loader 1 - 25b9fdef3061c7dfea744830774ca0e289dba7c14be85f0d4695d382763b409b

SnappyBee Loader 2 - b2b617e62353a672626c13cc7ad81b27f23f91282aad7a3a0db471d84852a9ac          

SnappyBee Payload - 1a38303fb392ccc5a88d236b4f97ed404a89c1617f34b96ed826e7bb7257e296

References

[1] https://www.trendmicro.com/en_gb/research/24/k/earth-estries.html

[2] https://www.darktrace.com/blog/salty-much-darktraces-view-on-a-recent-salt-typhoon-intrusion

[3] https://learn.microsoft.com/en-us/windows/win32/dlls/dllmain#parameters

[4] https://mbed-tls.readthedocs.io/projects/api/en/v2.28.4/api/file/arc4_8h/#_CPPv418mbedtls_arc4_cryptP20mbedtls_arc4_context6size_tPKhPh

Inside the SOC
Darktrace cyber analysts are world-class experts in threat intelligence, threat hunting and incident response, and provide 24/7 SOC support to thousands of Darktrace customers around the globe. Inside the SOC is exclusively authored by these experts, providing analysis of cyber incidents and threat trends, based on real-world experience in the field.
Written by
Nathaniel Bill
Malware Research Engineer

More in this series

No items found.

Blog

/

AI

/

June 25, 2026

Shadow AI Detection: The First Step Toward Securing AI

Default blog imageDefault blog image

Why shadow AI is emerging  

Imagine you’re an employee under pressure, deadlines stacking up, repetitive tasks piling higher by the day. You find a free AI tool online that promises to automate the work in seconds; no approvals are needed. It feels like a simple win, paste in some data, write a quick prompt, and move faster.

But in that moment, something changed.  

Sensitive customer information is entered into a tool your organization doesn’t monitor, doesn’t govern, and can’t see and suddenly, that data is no longer where it should be, and no one knows where it’s gone.

This is the reality of Shadow AI: employees using unsanctioned AI tools to move faster, while unintentionally creating risk that exists entirely outside visibility and control.  

This is not just a one off case, research across businesses indicate that nearly half of employees report using unsanctioned AI tools, often prioritizing speed and productivity over security. Additionally, 51% of employees report connecting AI tools to work systems or apps without IT approval, creating significant operational risk where the average cost of security incidents in organizations with a high level of shadow AI usage can reach $670k.

While shadow AI is often top of mind for security professionals, it is just one component of how AI use can increase risk. Understanding and managing shadow AI use should be considered as part of a broader, comprehensive risk management strategy that aims to secure AI systems, including human and agent identities, interactions, human-AI partnerships, and behaviors operating across the digital enterprise from visibility and governance through detection, response, and recovery.  

Effective risk management calls for a layered and interdisciplinary strategy. It requires addressing issues across governance and visibility; identity, access and agent control, data security and privacy, secure MLOps / LLMOps, runtime security, behavior-based detection, autonomous response and recovery.  

This blog explores a specific governance and visibility use case linked to shadow AI and reveals the challenges it presents as well as the defensive strategies that security teams can adopt.

Why shadow AI is hard to detect  

When it comes to AI, what organizations can easily see does not always reflect the full scope of AI activity occurring within the tools, applications, and workflows used across an enterprise. As a result, organizations using traditional rule-based methods to flag unusual activity may struggle to distinguish unsanctioned AI usage from legitimate operational behavior, particularly as SaaS applications, APIs, and orchestration layers increasingly have AI embedded into normal business workflows. Identifying threats using previously observed intelligence or depending on hard to maintain allow and block lists does not provide a dynamic enough strategy to manage risk. Also, many organizations are focusing on identifying Shadow AI in their governed infrastructure, like gateways, endpoints, or SASE, which is foundational. But, organizations require visibility and Shadow AI detection across all networked infrastructure from on-prem, hybrid, data centers, and cloud infrastructure that may not have endpoint agent visibility. This uncovers the utilization of MCP, data flows, and autonomous agents across these domains.

For example, employees interact with AI assistants across approved SaaS platforms every day. However, browser extensions and other types of plug-ins can route prompts that include enterprise data to embedded AI services in ways that are not visible to the security team. AI enabled workflows may invoke multiple APIs, orchestration layers, and cloud services behind the scenes, making it difficult for traditional security tooling to determine where data is processed, stored, or retransmitted. Because much of this activity occurs within trusted browser sessions and encrypted SaaS traffic, conventional network monitoring, DLP, and application allowlisting controls often lack the context needed to accurately identify or govern these interactions

Identifying AI tools in the environment is one part of the equation. Understanding the behavior surrounding their use is where the real challenge lies. An AI application is not inherently risky, but the way users or other assets interact with it may be. Sensitive data exposure, abnormal access patterns, and misuse of AI-assisted workflows often appear legitimate in isolation and only become visible through behavioral analysis across the broader environment.  

What Shadow AI visibility does and doesn’t show

Comprehensive Shadow AI visibility allows organizations to answer several important questions:

  • What types of AI are we using? What AI platforms, agents, MCP clients/servers, and services are active across the enterprise?  
  • Who is using AI services? Which users, business units, or systems are interacting with those AI services?  
  • Is our data safe? Is sensitive or regulated data being exposed through prompts, workflows, or integrations?  
  • Are AI systems behaving as expected? Are AI systems behaving anomalously or operating outside approved governance processes?  
  • Are our AI systems under attack? Is an attacker attempting to manipulate prompts, influence agent behavior, or abuse AI-enabled workflows?

Answering these questions is foundational to broader AI governance efforts. However, it is limited to helping teams understand initial interactions and fails to offer insight into dependencies and outcomes that are critical to securing AI across an enterprise.  

Deeper visibility that includes the ability to understand dependencies and outcomes are not always available in AI security point products. Answering the questions below requires understanding runtime behavior and operational outcomes:  

  • What actions did the AI interaction trigger?  
  • What systems, applications, or data did it access? Did the AI operate beyond its intended permissions or scope?  
  • Could a low-risk interaction lead to high-risk outcomes?  
  • What is the risk and context understanding of an anomalous activity to assist in prioritization of analysis and autonomous response action?

The distinction between these two sets of questions offers two different layers of AI security. The first set of questions focuses on discovery and interaction visibility. The second set focuses on providing visibility that includes the context and outcomes that are critical for managing follow-on risks associated with obfuscated downstream activities.  

Together, these layers help organizations move beyond simply identifying AI usage toward understanding how AI behaves operationally across the enterprise.

How organizations are addressing shadow AI

Most organizations still approach shadow AI as an application control problem, relying on policies, browser restrictions, and allow/block lists. However, AI adoption is evolving faster than most governance processes can realistically keep pace with. New assistants, plugins, and embedded AI features appear continuously, creating pressure to enable business productivity while simultaneously containing risk.  

Existing governance processes were designed for a more traditional SaaS adoption cycle, where new applications could be reviewed, approved, and monitored over longer time horizons. AI adoption operates differently. New capabilities can appear overnight inside existing platforms employees already use, making it difficult for security and governance teams to maintain an accurate understanding of enterprise AI exposure. This means that many organizations are experiencing significant operational overhead, particularly in large environments where AI usage is decentralized across teams, departments, and third-party services.  

Where should organizations start when securing their AI systems?

Shadow AI identification is an on-going critical component for AI Risk/Governance Boards as well as security organizations. As organizations seek AI certifications like ISO 42001 AI Management Systems, visibility into all AI adoption from enterprise use to custom innovation and development is crucial. Shadow AI identification provides organizations with the visibility needed to decide whether an AI tool should be brought into governed environments to reduce data loss (DLP) risks or whether policies should be established and enforced to restrict their use.

As organizations rapidly innovate and adopt AI, they are taking on more and more risk. Organizations need to have a strategy in place to mitigate the assumed risk, especially with third-party adoption. Visibility, monitoring, governance enforcement, behavioral-based detection of non-deterministic systems, and autonomous investigation and containment becomes critical to mitigating the risk of AI systems.  

How Darktrace secures AI and shadow AI

Attackers are using AI to move faster, scale tactics, and make threats more adaptive and convincing. Internally, organizations are grappling with new forms of risk created by generative AI, autonomous agents, shadow AI, and increasingly complex digital environments.

Darktrace helps organizations protect both people and AI in a world where AI is now central to how business gets done. Darktrace / SECURE AI helps organizations discover and control shadow AI by surfacing unsanctioned or unexpected AI activity where it appears – including MCP detections, distinguishing misuse of legitimate tools and unapproved services, and applying policy to contain data exposure while guiding users toward sanctioned options.

Stay up to date on AI security

Sign up for the Secure AI Readiness Program here: This gives you exclusive access to the latest news on the latest AI threats, updates on emerging approaches shaping AI security, and insights into the latest innovations, including Darktrace’s ongoing work in this area.

Ready to talk with a Darktrace expert on securing AI? Register here to receive practical guidance on the AI risks that matter most to your business, paired with clarity on where to focus first across governance, visibility, risk reduction, and long-term readiness.  

Continue reading
About the author

Blog

/

Network

/

June 25, 2026

From Click to Command: Behavioral Detection of AppleScript-Led MacOS Intrusions

Default blog imageDefault blog image

Introduction

Darktrace’s Threat Research team is publishing this analysis to help defenders understand an active pattern of macOS tradecraft observed in multiple customer environments. This post summarizes the behaviors observed, how they were assessed, and what defenders can do now.

Across multiple environments, Darktrace observed a consistent MacOS intrusion pattern beginning with ClickFix-style user-assisted “update” execution and transitioning into AppleScript-driven post-compromise activity and sustained outbound signaling.

While individual indicators were low-confidence, the repeated convergence of weak behavioral signals — including HTTP POST beaconing, rare or IP-only destinations, SSL anomalies, and abnormal client characteristics — provided a defensible indication of command-and-control establishment Darktrace detection and response in these cases was driven by behavior over artifacts. In the highest-confidence instances, automated containment disrupted outbound signaling before sustained tasking could occur.

Background

ClickFix-style activity typically relies on user-assisted execution and plausible “update” pretexting, followed by post-execution use of native tools to keep the footprint light. In MacOS environments, AppleScript and other built-in scripting mechanisms enable flexible post-compromise workflows while minimizing stable file-based indicators.

Following execution, affected devices exhibited a consistent behavioral pattern. AppleScript or equivalent native scripting activity was observed initiating follow-on workflows, after which outbound communications began to establish a structured rhythm.

These communications were characterized by repeated HTTP POST requests to low-prevalence or IP-only endpoints, often combined with unusual SSL properties and client identifiers that diverged from baseline device behavior. Individually, these signals were weak. When correlated across time and devices, they formed a pattern consistent with control establishment rather than benign software activity.

In higher-confidence cases, Autonomous Response actions were able to reduce or halt outbound signaling, interrupting the attacker’s ability to maintain control.

Detection Timeline

In representative cases, the sequence unfolded as follows:

Stage 1 – Initial Execution

Initial activity began with suspicious or masqueraded execution on a MacOS endpoint, consistent with ClickFix-style user deception.

Stage 2 – Post-Execution Scripting

This was followed closely by native scripting activity, most commonly AppleScript, indicating the transition into post-execution workflow.

Stage 3 – Outbound Communications

Outbound communications then emerged, initially sporadic but quickly forming a consistent cadence of HTTP POST requests to rare external endpoints.

Stage 4 – Anomaly Convergence

As activity persisted, additional anomalies became visible — unusual SSL characteristics, abnormal user agents, and connections to infrastructure with no prior network prevalence.

Stage 5 – Autonomous Response

In the most mature stages of the activity, automated containment actions disrupted outbound communications on affected devices, limiting the attacker’s ability to continue tasking while investigations progressed.

Darktrace coverage and detections

The following use-case highlights systems likely affected by malicious macOS intrusion activity linked by Microsoft to the Democratic People’s Republic of Korea (DPRK) [1], with indications of suspicious behavior observed between March 1 and May 3, 2026. The activity overlaps with patterns described in recent reporting on DPRK-nexus MacOS intrusions [1], though attribution confidence in this case remains moderate and based on behavioral alignment rather than solely infrastructure linkage.

Analyst confidence emerged through the correlation of multiple weak signals across time and devices. This included model coverage for rare external communications, sustained beaconing patterns, repeated HTTP POSTs, and anomalous client characteristics. Where enabled, Autonomous Response actions disrupted the most active outbound paths to reduce the attacker’s ability to maintain control while Darktrace’s investigation continued.

Notably, this highly anomalous behavior included:

  • Outbound connections to the rare external endpoint, zoom[.]uswebob[.]us associated with IP address, 148.72.73[.]98 [2][3] over port 443
  • Outbound connections to the rare external endpoint, check02id[.]com associated with IP address, 83.136.210[.]180 [4] over port 7365
  • Outbound connections to the rare external endpoints, 104.145.210[.]107 [5] over port 8443 and 83.136.208[.]48 [6] over port 443
  • Outbound connections to the rare external endpoint, 83.136.208[.]246 [7] over port 6783 with observed URI `/api/daemon` and a PowerShell user agent

Darktrace’s detection initially highlighted a desktop device (running MacOS) engaging in anomalous behavior as early as March 12, 2026. Starting on March 12, the source device triggered a ‘Possible Doppelganger Attack’ alert including connectivity to the hostname "zoom[.]uswebob[.]us · 148.72.73[.]98" over port 443 (TCP, HTTPS, H2). This model highlights a device connecting to a location that is rare but masquerades as legitimate software, such as Zoom in this case, a commonly used technique to blend into expected traffic [2] [3].

 Initial connectivity observed to the rare external hostname, zoom[.]uswebob[.]us · 148.72.73[.]98, over port 443.
Figure 1: Initial connectivity observed to the rare external hostname, zoom[.]uswebob[.]us · 148.72.73[.]98, over port 443.

This was followed roughly seven later by a connection to 104.145.210[.]107 over port 8443, during which approximately 250 KiB of data of inbound data and 30 MiB of outbound data was observed, triggering the ‘Unusual Activity / Unusual External Data to New Endpoint’ in Darktrace.

Quickly after this connection, Darktrace’s Autonomous Response intervened, blocking the device’s access to the unusual external location and halting the data exfiltration attempt.

Figure 2: Darktrace’s detection of unusual data exfiltration, shortly followed by an Autonomous Response action to block it.

The device continued to consistently trigger model alerts relating to unusual external connectivity, including 'Posting HTTP to IP Without Hostname', 'Anomalous Connection / Rare External SSL Self-Signed' alerts, until well after 3 PM that day.

Figure 3: Additional external connectivity to new IP without a hostname, including connectivity to 83.136.208[.]246, alongside an anomalous ‘curl/8.7.1’ user agent and ‘/api/daemon’ URI.
Figure 4: Continued external SSL connectivity to IP 83.136.208[.]48, including connectivity to 83.136.208[.]246, alongside an anomalous ‘curl/8.7.1’ user agent and ‘/api/daemon’ URI.
Figure 5: Continued external HTTP connectivity to hostname, check02id[.]com · 83.136.210[.]180, alongside an anomalous ‘Go-http-client/1,1’ user agent.

From March 13 to March 28, the device continued exhibit unusual connectivity to various endpoints (e.g., 83.136.208[.]48, 83.136.208[.]246, check02id[.]com · 83.136.210[.]180), with the 'Multiple HTTP POSTs to Rare Hostname' model consistently triggering.

Windows OS Case

Pivoting over to an additional device, this time running Windows OS, anomalous behavior was also observed between March 30 and April 20. Notably, on March 30, the device was observed making a large number of suspicious external connection attempts to 83.136.208[.]246 over port 6783, all of which failed.

A further indicator was observed on April 1 with PowerShell connectivity to the same rare endpoint (83.136.208[.]246, port 6783), using the URI '/api/daemon' and the user agent 'Mozilla/5.0 (Windows NT; Windows NT 10.0; fr-FR) WindowsPowerShell/5.1.26100.7920'.  Additional alerts included 'New User Agent to IP Without Hostname' and 'Anomalous Github Download', alongside activity involving the same endpoint.

Figure 6 : ‘Anomalous Powershell to Rare External Destination’ and ‘Github Download’ model alerts. This behavior involved connectivity with the endpoints ‘83.136.208[.]246’ and ‘github[.]com’.

The device continued triggering 'Posting HTTP to IP Without Hostname' & 'PowerShell to External Rare' alerts between April 4 and April 20 across multiple related endpoints (i.e., 83.136.208[.]48, 83.136.208[.]246, check02id[.]com · 83.136.210[.]180).

Darktrace’s Autonomous Response capability was able to block suspicious PowerShell attempts to unusual external locations, as shown below in an example from April 20.

Figure 7:  Autonomous Response intervening to block an unusual PowerShell connection to an external destination.

Cyber AI Analyst investigations

In higher-confidence instances, Darktrace’s Cyber AI Analyst investigations helped connect otherwise separate model alerts into a single incident narrative, highlighting the attacker’s progression from post-execution scripting into sustained outbound signaling. This contextual stitching is particularly valuable in macOS scenarios where static artefacts are limited, and behavioral sequencing defines the intrusion.

Cyber AI Analyst investigations highlighted alerts on March 12, including unusual repeated connections and possible SSL command-and-control (C2) to multiple endpoints:

Figure 8: Cyber AI Analyst investigation linking events into a unified incident.

Autonomous Response

In addition to the containment actions detailed earlier, Autonomous Response implemented multiple additional measures to contain suspicious activity throughout the course of this attack. Whenever unusual external connectivity was detected, Darktrace blocked it, closing down potential C2 channels. Likewise, when data exfiltration attempts were identified, these connections were stopped to prevent the potential loss of sensitive data.

Figure 9: Autonomous Response actions implemented by Darktrace in response to suspicious connectivity in mid-March.

Furthermore, in cases where a device was deemed to have carried out a significant number of anomalous activities, Darktrace enforced a “pattern of life” on the device, preventing it from deviating from its expected behavior while allowing legitimate business operations to continue uninterrupted.

Figure 10: Autonomous Response actions implemented by Darktrace in response to suspicious connectivity in April, including the “Enforce Pattern of Life” action.

Conclusion

macOS intrusion tradecraft continues to shift toward native tooling and lightweight control channels designed to evade signature-led controls.

The repeated convergence of rare destinations, POST-based signaling, and anomalous client behavior — observed across time and across devices — provided sufficient evidence to act early and with confidence.

As macOS tradecraft continues to evolve, the defender advantage increasingly lies not in signatures, but in the ability to reason from behavior.

Credit to Justin Torres (Senior Cyber Analyst), Nathaniel Jones (VP, Security & AI Strategy, FCISO)

Edited by Ryan Traill (Content Manager)

Appendices

Darktrace Model Alert Coverage:

/ NETWORK-based model alerts:

·       Anomalous Connection::Multiple HTTP POSTs to Rare Hostname

·       Anomalous Connection::Rare External SSL Self-Signed

·       Anomalous Connection::Powershell to Rare External

·       Anomalous Connection::New User Agent to IP Without Hostname

·       Anomalous Connection::Posting HTTP to IP Without Hostname

·       Compromise::Fast Beaconing to DGA

·       Compromise::Large Number of Suspicious Failed Connections

·       Device::Anomalous Github Download

·       Device::New PowerShell User Agent

·       Unusual Activity::Unusual External Data to New Endpoint

/ NETWORK-based Autonomous Response model alerts:

·       Antigena / Network::Significant Anomaly::Antigena Significant Anomaly from Client Block

·       Antigena / Network::Significant Anomaly::Antigena Controlled and Model Breach

·       Antigena / Network::Significant Anomaly::Antigena Breaches Over Time Block

Indicators of Compromise (IoCs)

IP/Hostname:

·       zoom[.]uswebob[.]us · 148.72.73[.]98

·       83.136.208[.]246

·       check02id[.]com · 83.136.210[.]180

·       83.136.208[.]48

·       104.145.210[.]107

URIs:

·       /api/daemon

Destination Port Usage:

·       6783

·       5202

·       443

·       7365

·       8443

ASN:

·       AS400897 PETROSKY

·       AS398256 AS-ULTAHOST

User agents:

·       Mozilla/5.0 (Windows NT; Windows NT 10.0; fr-FR) WindowsPowerShell/5.1.26100.7920

·       Go-http-client/1.1

·       curl/8.7.1

MITRE ATT&CK Mapping

(Technique Name - Tactic - ID - Sub-Technique of)

·       Browser Session Hijacking - COLLECTION - T1185

·       Web Protocols - COMMAND AND CONTROL - T1071.001 - T1071

·       Install Digital Certificate - RESOURCE DEVELOPMENT - T1608.003 - T1608

·       PowerShell - EXECUTION - T1059.001 - T1059

·       Domain Generation Algorithms - COMMAND AND CONTROL - T1568.002 - T1568

·       Non-Standard Port - COMMAND AND CONTROL - T1571

·       Malware - RESOURCE DEVELOPMENT - T1588.001 - T1588

·       Web Service - COMMAND AND CONTROL - T1102

·       Code Repositories - COLLECTION - T1213.003 - T1213

·       Exploitation of Remote Services - LATERAL MOVEMENT - T1210

·       Exfiltration Over C2 Channel - EXFILTRATION - T1041

·       Exfiltration to Cloud Storage - EXFILTRATION - T1567.002 - T1567

References:

[1] https://www.microsoft.com/en-us/security/blog/2026/04/16/dissecting-sapphire-sleets-macos-intrusion-from-lure-to-compromise/

[2] https://radar.securityalliance.org/advisory-on-dprk-unc1069-fake-microsoft-teams-and-zoom-calls/

[3] https://www.virustotal.com/gui/domain/uswebob.us

[4] https://www.virustotal.com/gui/ip-address/83.136.210.180/community

[5] https://www.virustotal.com/gui/ip-address/104.145.210.107/community

[6] https://www.virustotal.com/gui/ip-address/83.136.208.48/community

[7] https://www.virustotal.com/gui/ip-address/83.136.208.246/community

[8] https://www.darktrace.com/blog/applescript-abuse-unpacking-a-macos-phishing-campaign

Continue reading
About the author
Justin Torres
Cyber Analyst
あなたのデータ × DarktraceのAI
唯一無二のDarktrace AIで、ネットワークセキュリティを次の次元へ