
Investigating Cloud Attacks with Forensic Acquisition & Investigation
Darktrace / Forensic Acquisition & Investigation™ is the industry’s first truly automated forensic solution purpose-built for the cloud. This blog will demonstrate how an investigation can be carried out against a compromised cloud server in minutes, rather than hours or days.
The compromised server investigated in this case originates from Darktrace’s Cloudypots system, a global honeypot network designed to observe adversary activity in real time across a wide range of cloud services. Whenever an attacker successfully compromises one of these honeypots, a forensic copy of the virtual server's disk is preserved for later analysis. Using Forensic Acquisition & Investigation, analysts can then investigate further and obtain detailed insights into the compromise including complete attacker timelines and root cause analysis.
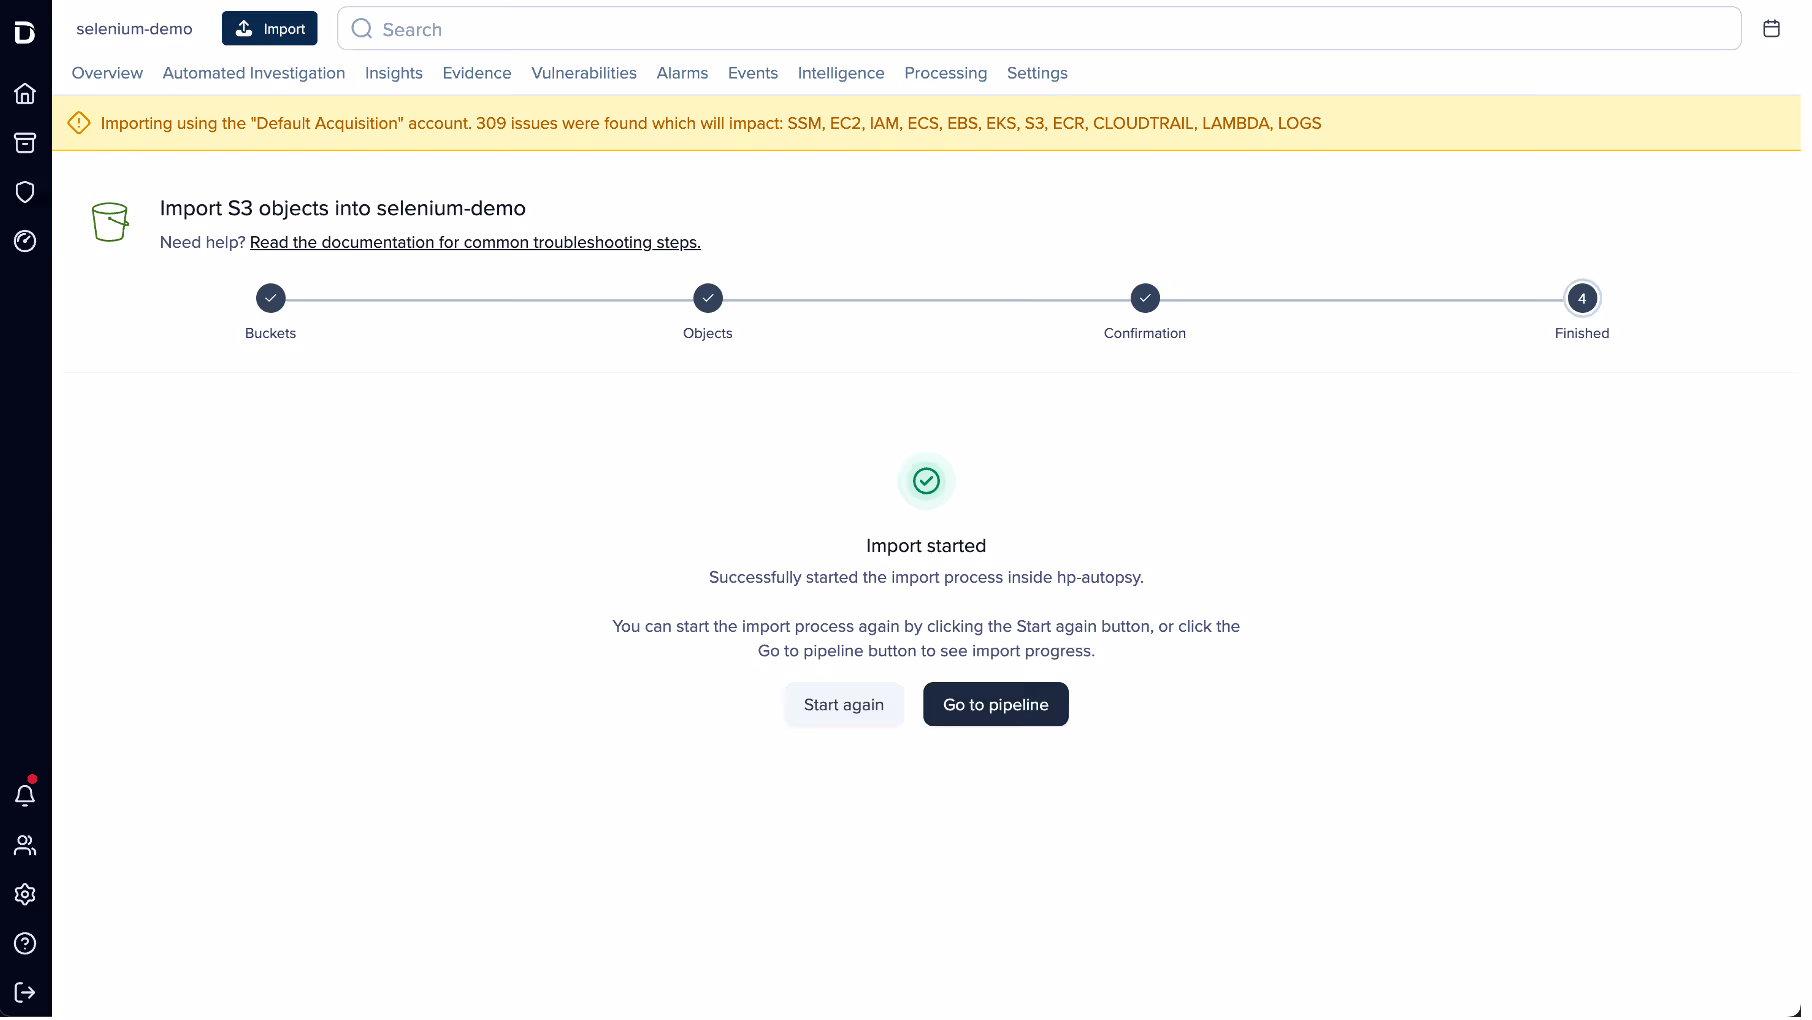
Forensic Acquisition & Investigation supports importing artifacts from a variety of sources, including EC2 instances, ECS, S3 buckets, and more. The Cloudypots system produces a raw disk image whenever an attack is detected and stores it in an S3 bucket. This allows the image to be directly imported into Forensic Acquisition & Investigation using the S3 bucket import option.
As Forensic Acquisition & Investigation runs cloud-natively, no additional configuration is required to add a specific S3 bucket. Analysts can browse and acquire forensic assets from any bucket that the configured IAM role is permitted to access. Operators can also add additional IAM credentials, including those from other cloud providers, to extend access across multiple cloud accounts and environments.

Forensic Acquisition & Investigation then retrieves a copy of the file and automatically begins running the analysis pipeline on the artifact. This pipeline performs a full forensic analysis of the disk and builds a timeline of the activity that took place on the compromised asset. By leveraging Forensic Acquisition & Investigation’s cloud-native analysis system, this process condenses hour of manual work into just minutes.
Once processing is complete, the preserved artifact is visible in the Evidence tab, along with a summary of key information obtained during analysis, such as the compromised asset’s hostname, operating system, cloud provider, and key event count.
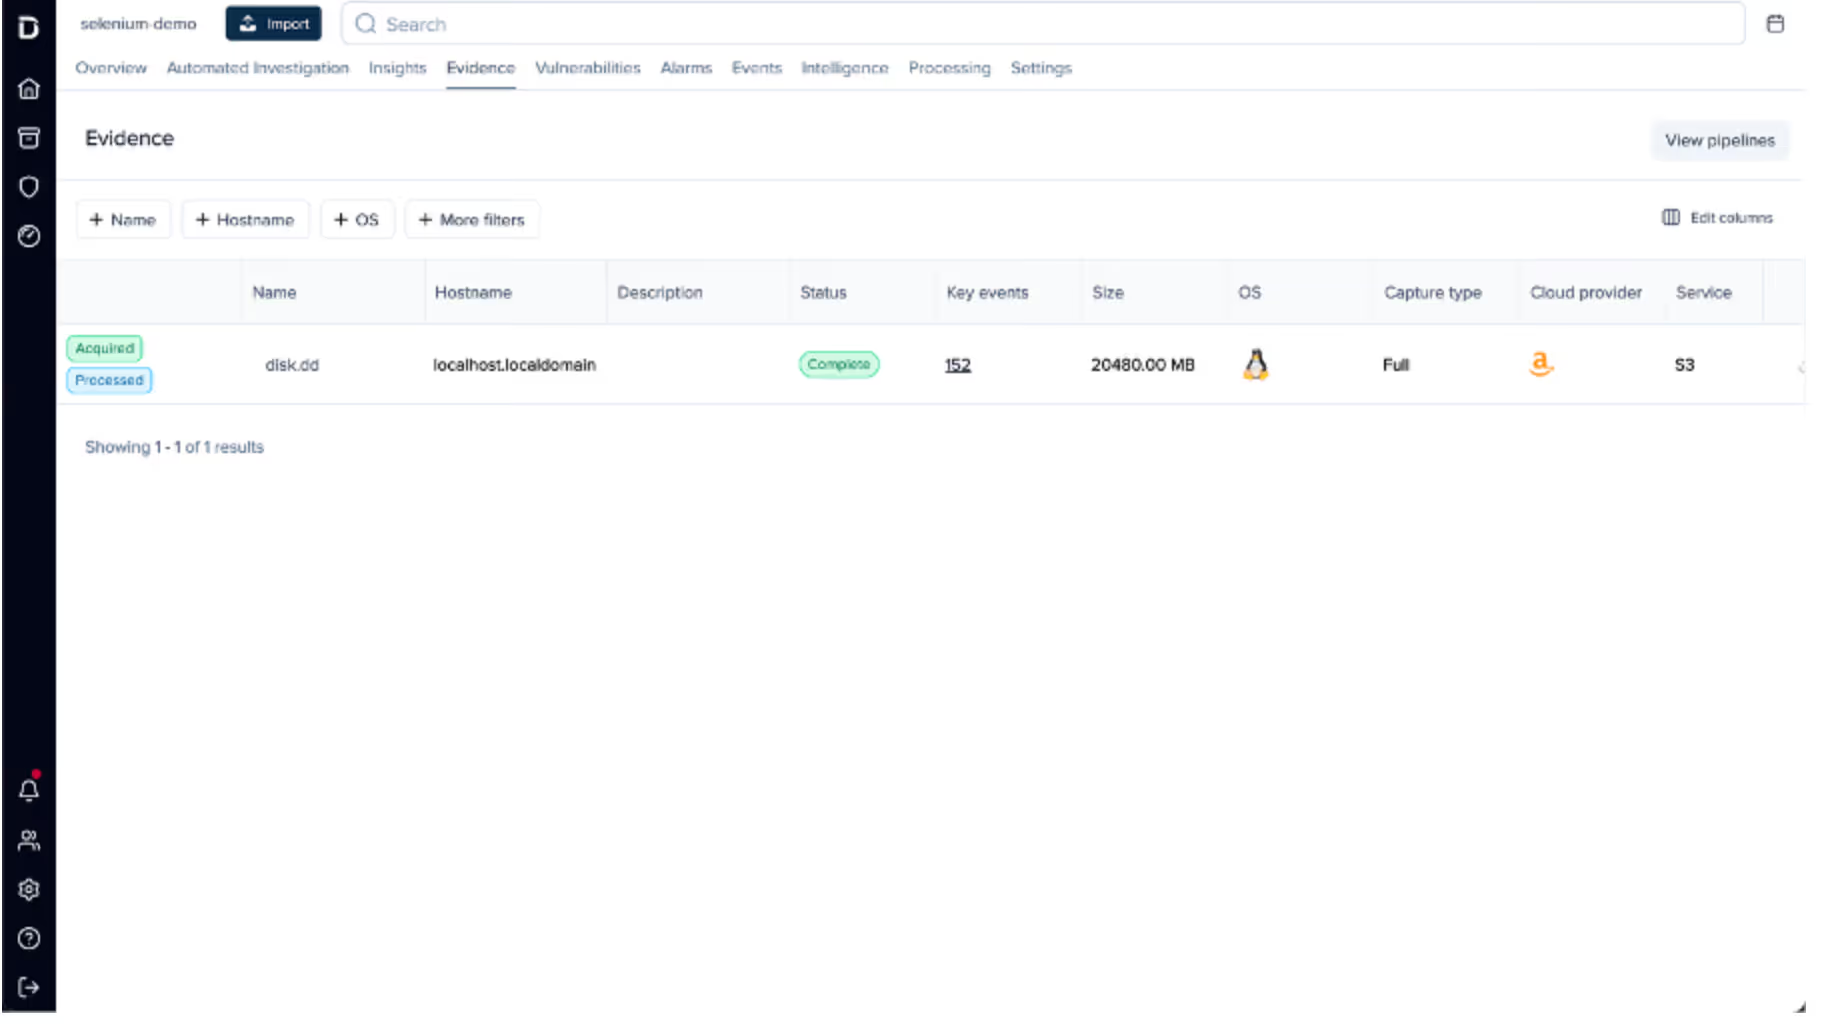
Clicking on the “Key events” field in the listing opens the timeline view, automatically filtered to show system- generated alarms.
The timeline provides a chronological record of every event that occurred on the system, derived from multiple sources, including:
- Parsed log files such as the systemd journal, audit logs, application specific logs, and others.
- Parsed history files such as .bash_history, allowing executed commands to be shown on the timeline.
- File-specific events, such as files being created, accessed, modified, or executables being run, etc.
This approach allows timestamped information and events from multiple sources to be aggregated and parsed into a single, concise view, greatly simplifying the data review process.
Alarms are created for specific timeline events that match either a built-in system rule, curated by Darktrace’s Threat Research team or an operator-defined created at the project level. These alarms help quickly filter out noise and highlight on events of interest, such as the creation of a file containing known malware, access to sensitive files like Amazon Web Service (AWS) credentials, suspicious arguments or commands, and more.
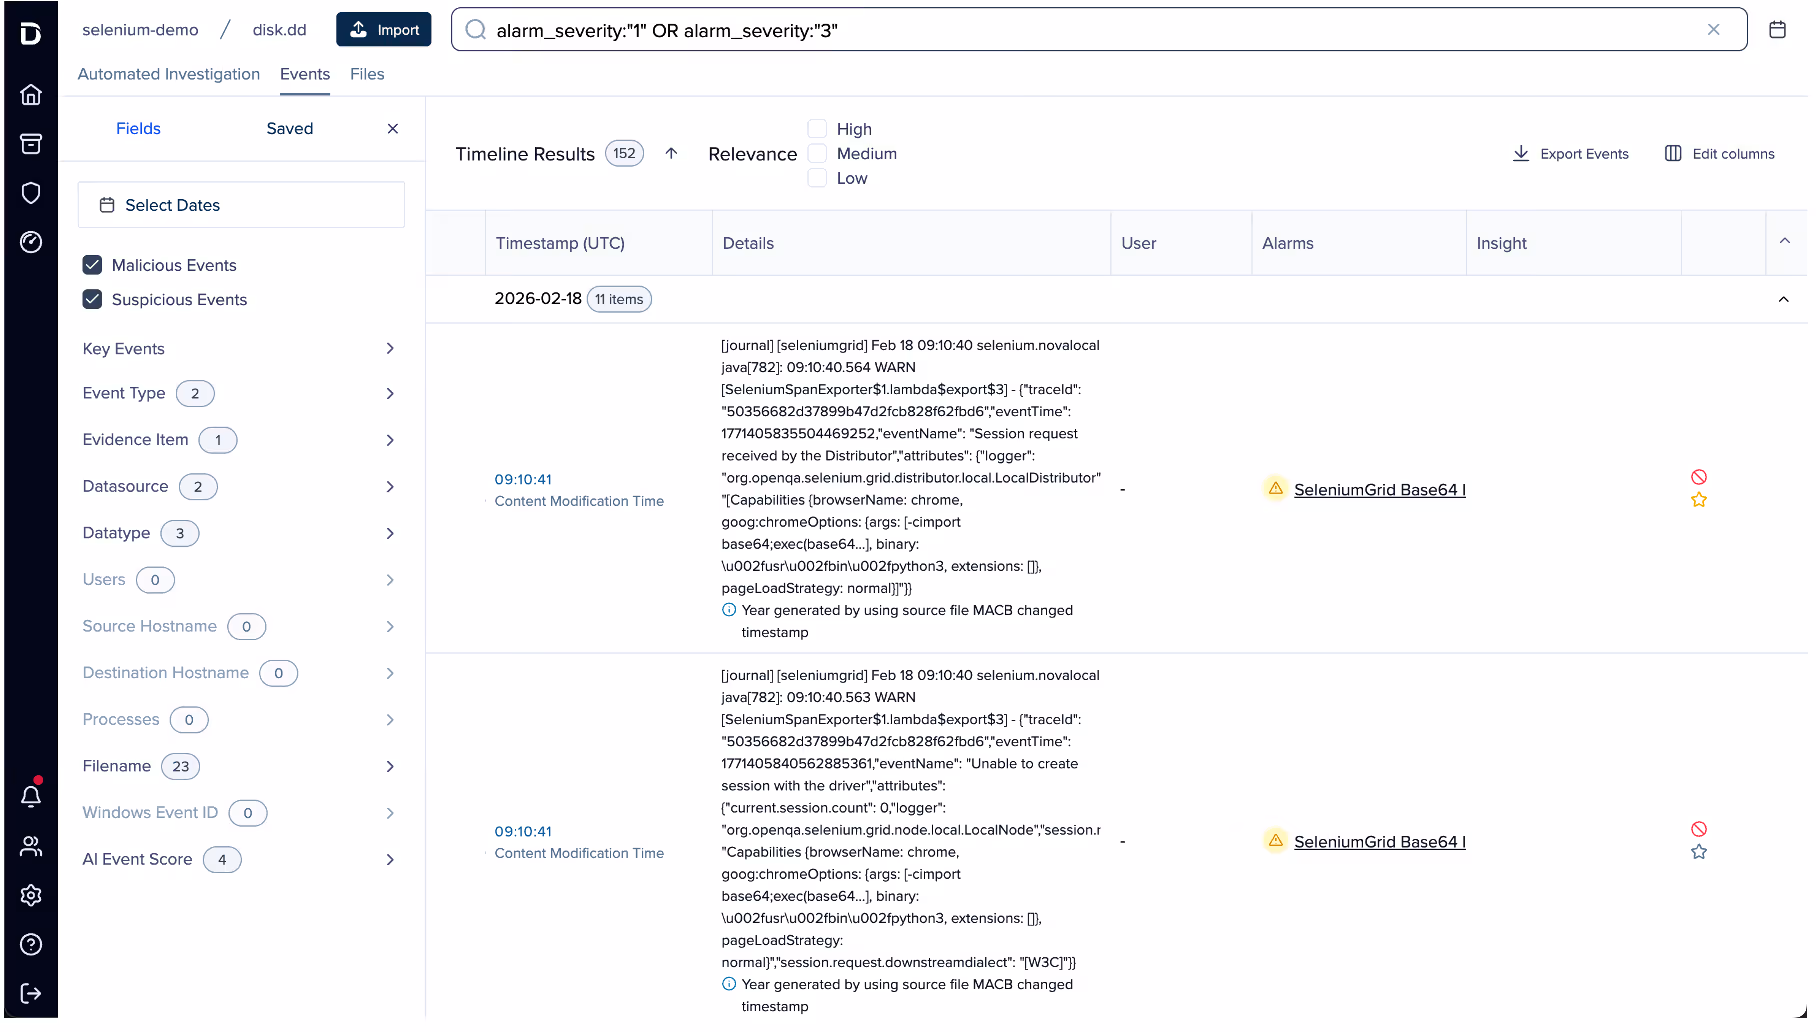
In this case, several alarms were generated for suspicious Base64 arguments being passed to Selenium. Examining the event data, it appears the attacker spawned a Selenium Grid session with the following payload:
"request.payload": "[Capabilities {browserName: chrome, goog:chromeOptions: {args: [-cimport base64;exec(base64...], binary: /usr/bin/python3, extensions: []}, pageLoadStrategy: normal}]"
This is a common attack vector for Selenium Grid. The chromeOptions object is intended to specify arguments for how Google Chrome should be launched; however, in this case the attacker has abused the binary field to execute the Python3 binary instead of Chrome. Combined with the option to specify command-line arguments, the attacker can use Python3’s -c option to execute arbitrary Python code, in this instance, decoding and executing a Base64 payload.
Selenium’s logs truncate the Arguments field automatically, so an alternate method is required to retrieve the full payload. To do this, the search bar can be used to find all events that occurred around the same time as this flagged event.
![Pivoting off the previous event by filtering the timeline to events within the same window using timestamp: [“2026-02-18T09:09:00Z” TO “2026-02-18T09:12:00Z”].](https://cdn.prod.website-files.com/626ff4d25aca2edf4325ff97/69a8a18526ca3e653316a596_Screenshot%202026-03-04%20at%201.17.50%E2%80%AFPM.avif)
Scrolling through the search results, an entry from Java’s systemd journal can be identified. This log contains the full, unaltered payload. GCHQ’s CyberChef can then be used to decode the Base64 data into the attacker’s script, which will ultimately be executed.[NJ9]


.jpg)